Water Quality Monitoring

Monitoring the quality of purified water used in laboratories is essential because contaminants can disrupt experiments, resulting in inaccurate findings and potentially compromising research integrity. Ensuring high-purity water helps to maintain consistent and reliable scientific results.
Two classes of contaminants, inorganic salts and dissolved organics, are known to affect most laboratory experiments. It is therefore important to monitor ionic and organic contaminants in the water delivered by laboratory water purification systems. Online monitoring of water quality can significantly reduce the risk of contamination from the surrounding air or any container the water touches. This reliable, up-to-date information allows users to confirm that the water is of the expected purity and that the water purification system is functioning correctly.
Measuring resistivity to detect ions in water
Electrical conductivity in water and its measurement
Electrical conductivity measures how well a material can conduct an electric current. Pure water has low electrical conductivity. Since electric current is transported in water by dissolved ions, conductivity measurements provide a quick and reliable way to monitor the total amount of ionic contaminants in water.
Conductivity is directly proportional to the concentration of ions carrying charges, the charge each ion carries (valence), and their mobility. Ion mobility depends on temperature, therefore conductivity measurements are also temperature-dependent. Hence, the conductivity of water is typically reported compensated at 25°C, in µS/cm @25°C.
The conductivity of aqueous solutions is as follows:
σ = F . Σci zi µi
where σ is conductivity, F is the Faraday constant (96485 C·mol⁻¹), ci is the concentration of ion i, zi is the charge number of ion i, and µi is the ion mobility of ion i.
Conductivity of ultrapure water
In theoretically pure water, free of any ionic contamination, the only two ionic species in solution come from the dissociation of water: H+ and OH-. Therefore, σ = 0.055μS/cm at 25°C.
Resistivity of ultrapure water
Reporting conductivity values when dealing with high-purity water may be cumbersome. For this reason, resistivity, the reciprocal of conductivity is preferred for conductivity values below 1 µS/cm @25°C. Resistivity is expressed in MΩ·cm @25°C.
ρ=1/ σ
where ρ is resistivity, σ is conductivity
In the absence of any ionic contamination, the resistivity of ultrapure water is equal to 18.2 MΩ·cm at 25°C.
How resistivity meters work in Milli-Q® water systems
Since no existing resistivity cell could meet the strict requirements for measuring the high-purity water produced by Milli-Q® ultrapure water systems, we developed a specialized cell to accurately monitor resistivity levels. These resistivity meters address the following unique needs:
- The cell design is based on concentric electrodes that generate a large surface area and reduce the space between electrodes without risk of contact. This achieves the low cell constant (0.01 cm-1) recommended in ASTM® D5391-99.
- Electrodes are made of 316L stainless steel, which minimizes corrosion and risk of ion release.
- A flow-through cell design allows immediate detection of any ionic contamination in the water flow.
- Temperature measurement is performed by a thermistor with 0.1°C sensitivity that reacts rapidly and accurately to temperature variations in water.
- Meters display either resistivity or conductivity readings, compensated at 25°C or not.
- The meters’ electronic circuits are regularly verified by an automatic process, and alarm messages are sent if the electric or electronic parts are defective, ensuring that every result displayed is valid.
- The meters are calibrated with a method developed especially for use with high-resistivity water and are delivered with a certificate of calibration. The meters meet requirements for performance of USP <645> suitability tests.
Resistivity meters within Milli-Q® water purification systems provide continuous, reliable assurance that the water produced contains very low levels of ionic contaminants.

Figure 1.Schematic diagram of a high-precision coaxial resistivity cell found within Milli-Q® water purification systems.
Measuring TOC to detect organics in water
Water may contain hundreds of different organic substances at different levels of oxidation and at different concentrations. Organic contaminants in water can interfere with many laboratory applications, such as HPLC and LC-MS. TOC (Total Oxidizable Carbon, sometimes referred as Total Organic Carbon) is a value that expresses the total organic contamination of water.
A10® TOC monitor
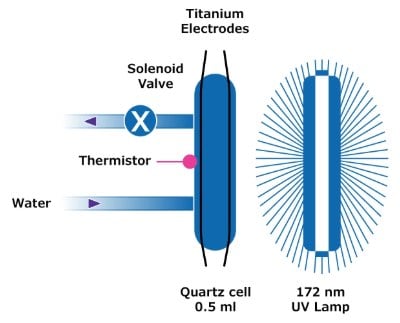
Rapid and highly accurate TOC measurements are achieved with the best-in-class online A10® monitor (Figure 2). This TOC monitor is available as a stand-alone unit or integrated within certain Milli-Q® water purification systems (e.g. Milli-Q® IQ 7000 system).

Figure 2.A10® TOC monitor photooxidation cell found within certain Milli-Q® ultrapure water systems and as a stand-alone unit.
The A10® TOC monitoring process is as follows:
- An aliquot of the water to be tested is captured in a 0.5 mL quartz cell.
- A 172 nm UV lamp is located next to the cell. When the lamp is powered, organic compounds in the water are oxidized by photocatalysis.
- The end product of this organic oxidation is carbon dioxide, which dissolves in the water and increases the conductivity. This change in conductivity is regularly monitored by titanium electrodes and temperature-compensated to 25°C.
- A set of complex algorithms confirms complete oxidation of the organics present and calculates the carbon level associated with this conductivity change.
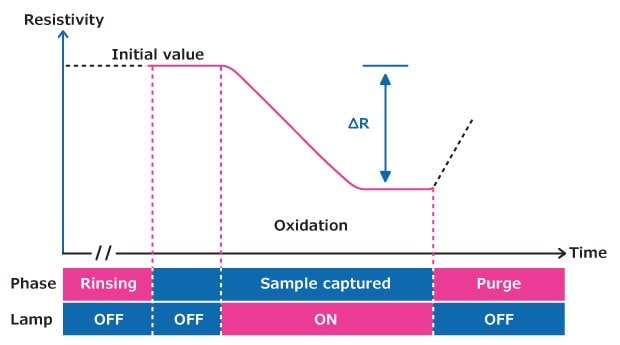
Figure 3 illustrates the evolution of resistivity over time during photooxidation in an A10® TOC measurement cell at a fixed temperature.

Figure 3.TOC measuring process within the A10® quartz cell.
The design of the A10® TOC monitor offers several benefits to scientists:
- High accuracy: As the oxidation and conductivity measurements occur within the same cell, the instrument checks that all organics are completely oxidized and that a stable conductivity value has been reached before delivering a TOC value.
- Wide range: The monitor is able to measure TOC values in the 0.5–999.9 ppb range.
- Rapid readings: The xenon excimer lamp (mercury-free) can instantly turn on/off, allowing a faster analysis time than with a mercury UV lamp.
- Reliable data: Each TOC monitor is calibrated for resistivity around two values: 18.0 MΩ·cm @25°C and 1 MΩ·cm @25°C, and for TOC with methanol over a range between 1 and 200 ppb. The calibration results of each TOC monitor are delivered with the instrument.
- Supports suitability testing: A10® TOC monitors meet the requirements for the performance of suitability tests as described in USP chapter <643>. Tests can be performed with the support of our certified service engineers.
Inline Milli-Q® TOC indicator
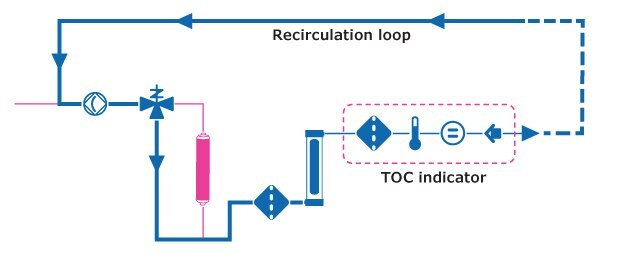
To ensure the reliability of organic-sensitive applications such as HPLC, our proprietary inline TOC indicator measures TOC of ultrapure water at the point of use.
The inline TOC indicating process is as follows:
- Once ultrapure water has been dispensed, water flows through the recirculation loop inside the system to the UV oxidation lamp, bypassing the polishing cartridge.
- UV radiation oxidizes neutral organics into charged molecules, increasing water conductivity.
- This change is detected by an intermediate resistivity sensor and is converted by an algorithm to a TOC value.
- The TOC indication appears on the touchscreen monitor after each dispense. TOC values displayed:
- ≤ 5 ppb, if 0–5 ppb
- ≤ 10 ppb, if 6–10 ppb
- >10–999 ppb, a whole number is displayed
This TOC indicator is available within certain Milli-Q® ultrapure water systems (e.g. Milli-Q® EQ 7000).

Figure 4.Milli-Q® TOC indicator.
Contact us if you would like support in selecting a water purification system that provides suitable quality monitoring for your lab and its applications.
Related Products
To continue reading please sign in or create an account.
Don't Have An Account?