DNA and RNA Quantification
Accurate determination of nucleic acid concentration and yield is important for downstream applications including transfection, cloning, PCR, and next generation sequencing (NGS). These applications often have a specific target nucleic acid concentration for optimal performance. Inaccurate quantification can increase variability in downstream assays and affect quality of results. DNA and RNA quantitation can be performed using any of the following methods:
- UV absorbance (optical density)
- Fluorescence measurement using nucleic acid-binding dyes
- Agarose gel electrophoresis
- qPCR
DNA quantitation using UV absorbance
The most common technique used to determine both nucleic acid concentration and purity is absorbance. Absorbance measurements can be used to estimate the concentration of DNA or RNA in purified samples. In this method, the nucleic acid sample is placed into a quartz cuvette, which is then placed inside the UV spectrophotometer. Small volume spectrophotometers such as the NanoDrop™ instrument, DeNovix DS-11 spectrophotometer, and Blue-Ray Bio EzDrop spectrophotometer enable the analysis of sample volumes as low as 1 µL using pedestals. UV light is passed through the sample at a specified path length, and concentrations of nucleic acids can be directly calculated by measuring absorbance values at 260 nm against a blank using the Beer-Lambert's equation:
A = εcl
where:
A = UV absorbance
ε = wavelength-dependent extinction coefficient
c = nucleic acid concentration
l = light path (cm)
Extinction coefficients*:
- dsDNA (pure): 0.020 (µg/mL)-1 cm-1
- ssDNA (pure): 0.027 (µg/mL)-1 cm-1
- ssRNA (pure): 0.025 (µg/mL)-1 cm-1
*It is important to note that this formula is only valid for large nucleic acid molecules with proportional compositions of nucleotides, such as genomic DNA or plasmids. For oligonucleotides and other short nucleic acid molecules such as miRNAs, the extinction coefficient should be calculated based on the sequence of the oligonucleotide.
To improve accuracy, the A260 measurement is often corrected for turbidity (measured by absorbance at 320 nm) using the following equation:
Concentration (µg/mL) = (A260 measurement – A320 measurement) x nucleic acid conversion factor** x dilution factor
**Conversion factor for dsDNA: 50 µg/mL
**Conversion factor for ssDNA: 37 µg/mL
**Conversion factor for ssRNA: 40 µg/mL
Total yield can then be obtained by multiplying the nucleic acid concentration by the final total purified sample volume.
DNA yield (µg) = DNA concentration × total sample volume (mL)
Absorbance measurements, contaminants, and nucleic acid purity
Molecules other than DNA or RNA can absorb light in the 260 nm range. Amino acids with aromatic rings present in proteins absorb light at 280 nm, which can affect absorbance measurements at 260 nm. Additionally, the presence of guanidine and other chaotropic salts or solvents, which are commonly used in silica-based DNA and RNA purification methods for binding, absorb light at 230 nm and can lead to higher 260 nm absorbance measurements through crossover. This suggests that if contaminants are present and the A260 number is used for calculation of yield, the amount of DNA may be overestimated.
To evaluate protein contamination, determine the ratio of the absorbance at 260 nm (nucleic acid absorbance) and 280 nm (absorbance of aromatic rings in protein amino acids, though phenol will also absorb at 280 nm). High quality DNA will have an A260/A280 ratio of 1.7–2.0. High quality RNA will have an A260/A280 ratio of ~2.0.
DNA purity (protein contaminants) = A260 reading ÷ A280 reading
To evaluate chemical contamination, the ratio of the absorbance at 260 nm and 230 nm can be used. Residual chaotropic salts and organic solvents, which can inhibit PCR, are known to absorb light in the 230 nm range. The A260/A230 ratio should be >1.5 for applications that are sensitive to chemical interference, including enzyme-based assays such as qPCR and sequencing. The lower the ratio, the greater the amount of organic compounds or chaotropic salts in the preparation.
DNA purity (chemical contaminants) = A260 reading ÷ A230 reading
Fluorometric methods for quantitation
Fluorometric methods are widely regarded as some of the most sensitive methods available for nucleic acid quantitation. These methods use fluorescent dyes that intercalate and bind nucleic acid grooves, bind DNA or RNA non-specifically, or selectively bind nucleic material. Differences in spectral characteristics of nucleic acid-bound fluorophores allow sample concentrations to then be determined.
Each nucleic acid dye has a specific excitation and emission wavelength. The DNA or RNA sample is measured using a fluorometer, and nucleic acid concentrations are then calculated by comparing fluorescence emission of the sample to a fluorescence curve generated using standards of known nucleic acid concentration. Different samples types (genomic DNA, plasmid DNA, etc.) each require their own standard curves. As with absorbance methods, calculated concentrations must be corrected for dilution factor as required.
Considerations when selecting a fluorescent nucleic acid dye for quantitation:
- Specificity: different dyes are optimized to measure dsDNA, ssDNA, RNA, or small RNAs (e.g., miRNA) based on their mechanism of binding and spectral properties - make sure you select a fluorescent dye that binds to your target of interest
- Sensitivity: highly sensitive fluorescent dyes allow you to use less sample or measure very low concentrations of nucleic acid
- Dynamic range: some reagents can be used to detect nucleic acid at low concentrations, but may lose linearity at higher concentrations; the reagent to be used has to be suitable for the expected concentration range of your samples
- Sample volume: if your sample volume is limited, pay attention to the sample volume required by the reagent or kit
- Sample format: some reagents and kits have been optimized for measurement in single tubes or cuvettes, while others are intended for use in microplates for higher throughput
- Instrumentation filters: check if your fluorometer has suitable excitation and emission filters for the selected dye
DNA and RNA quantitation by gel electrophoresis
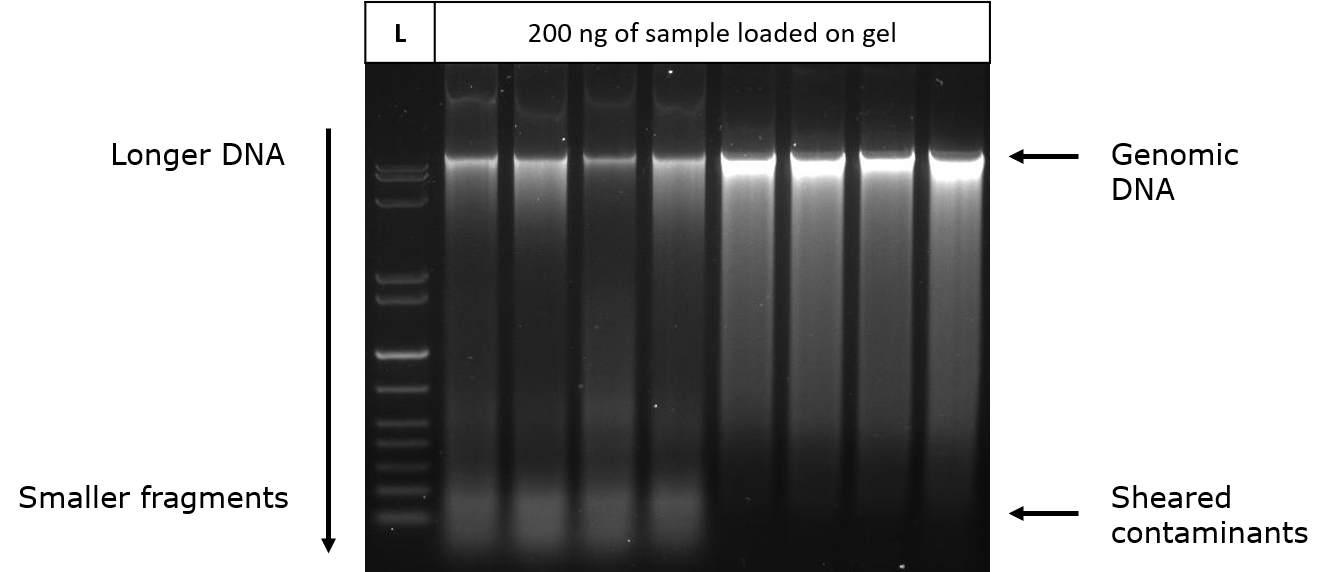
Because agarose gel electrophoresis separates DNA and RNA from other impurities, this method of quantitation eliminates some of the issues associated with calculations based on absorbance measurements. In agarose gel electrophoresis, a sample of the isolated DNA or RNA is loaded into a well of the agarose gel, which is placed in an electric field. The negatively charged nucleic acid migrates toward the anode, separating DNA and RNA fragments by size and shape. Agarose gel electrophoresis has the added benefit of enabling visualization of contaminating bands and sheared impurities within the sample. Nucleic acid concentration and yield can be determined by comparing the intensity of sample bands to standards of known amounts. Because DNA and RNA absorb light at 260 nm, intensity can be measured using a UV transilluminator. Higher sensitivity can be obtained by labeling nucleic acid samples and standards with a nucleic acid dye such as ethidium bromide or SYBR® Green and measuring intensity at the specified wavelength for that dye. If a 2 µL sample of undiluted DNA loaded onto the gel has the same intensity as a 100 ng standard, then the sample concentration is 50 ng/µL (100 ng ÷ 2 µL). Standards used for quantitation should be the same size as the sample nucleic acid being analyzed, and similarly labeled.

Figure 1. Agarose gel electrophoresis of prepared DNA. The first four lanes show greater sheared or low molecular weight nucleic acid contaminants in the preparation.
Quantitation by real-time PCR (qPCR)
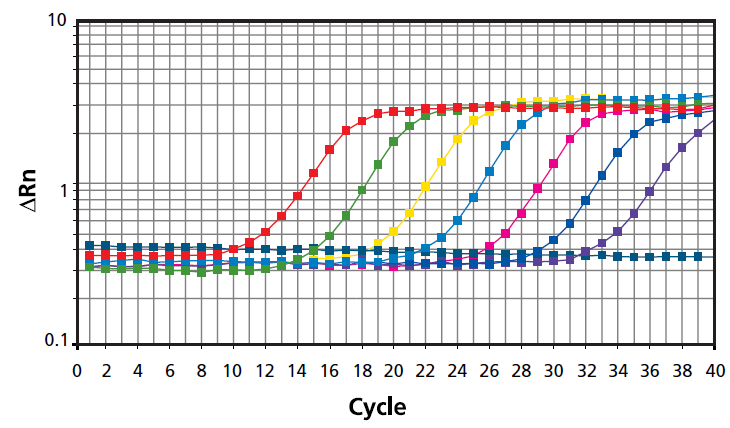
Real-time PCR, or quantitative PCR (qPCR), uses fluorometric probes that bind target DNA during the annealing phase of PCR or fluorescent dyes that bind double-stranded DNA. Specialized thermal cyclers equipped with fluorescence detection modules are used to monitor the fluorescence signal as amplification occurs. The measured fluorescence is proportional to the total amount of DNA. A standard curve is used to determine quantities of target DNA in test samples. It is also possible to use digital PCR methods to quantify DNA without a standard curve.
In the case of RNA quantitation, the PCR template is complementary DNA (cDNA), which is obtained by reverse transcription of the RNA.
One key advantage of real-time PCR is the ability to quantify specific target sequences based on the amount of amplifiable nucleic acid. This can be advantageous in quantifying genomic DNA, where the amounts of sheared DNA and smaller DNA and RNA fragments present in the sample are ignored in the measurement. Other benefits include the detection of inhibitors within the reaction mixture and the inherent specificity of the fluorometric probes.

Figure 2. Quantitative PCR (qPCR) was performed using SYBR Green fluorescent dye and 10-fold dilutions of template.
Conclusions
The appropriate DNA or RNA quantitation method should be chosen based on many factors including availability of equipment, intended downstream application, and throughput. Some quantitation methods have the added benefit of enabling determination of the biological and chemical purity of a sample. Caution should be used when comparing yields between methods as the presence of contaminants can lead to interference in measurements, resulting in over- or under-estimation of yield.
To continue reading please sign in or create an account.
Don't Have An Account?