How to Interpret Dose-Response Curves
Determining the optimal concentration of small molecule agonists or antagonists in experimental studies can be challenging. Learn how to interpret dose-response curves, Kd, and ED50 to find the right concentration for your next experiment.
Section Overview
What Is the Equilibrium Dissociation Constant (Kd)?
The equilibrium dissociation constant (Kd) is derived from the dose-response curve and is defined as the molar concentration of the ligand (L) at which 50% of the receptors (R) are occupied in a ligand-receptor complex (R-L).
The Kd equation is:

The Kd is a measure of chemical binding and may or may not exactly correlate with the EC50 value (which defines pharmacological response), depending on receptor signaling mechanics. However, it gives a strong measure of the receptor’s affinity to bind a drug molecule, with low Kd indicating high binding affinity and usually indicating a correspondingly low EC50 value.
It is important to pay attention to published Kd, EC50/IC50 values or determine these values through experimentation. A drug with a picomolar (pM) or nanomolar (nM) dissociation constant binds more tightly to a particular receptor protein than a drug with micromolar (µM) or millimolar (mM) dissociation constants. Solution conditions, such as temperature, pH, ionic strength, can also affect Kd. Choosing appropriate dosing concentrations based on the specific experimental model used will reduce possible data misinterpretation.
Dose-Response Curves
To select a suitable molecule for experimentation or a drug for therapeutic use, dose-response curves and the maximum pharmacological effect and maximum efficacy have to be determined. A drug’s ability to initiate a pharmacological response depends on multiple factors , such as:
- Drug-receptor binding avidity
- Receptor type or subtype
- Nature of antagonist
- Dose and receptor downstream signaling effects
Thus, a description of the dose-response relationship needs to be created empirically for the proper use of small molecules for their in vitro and in vivo use. Response to an antagonistic molecule is often complex and nonlinear.
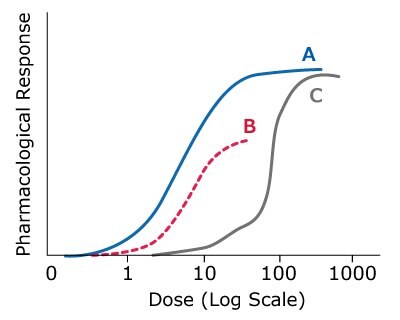
When creating a dose-response curve, a wide (log) range of drug concentrations is typically administered, and receptor/cellular/organism’s response is measured. These response curves are usually sigmoidal in shape (Figure 1) and are derived from the following equation, where E is the drug effect (response), Emax is the maximal response, and C is the drug concentration.


Figure 1.Comparison of dose-response curves for three different drugs.
Some drugs may initiate weak responses and have lower efficacy at moderate concentrations. In Figure 1:
- Drug A has the greatest pharmacological activity per dosing equivalent and is the most potent drug.
- Drugs A and C have equal efficacy, and although drug B is more potent than drug C, it has lower maximum efficacy.
- Drug B initiates a response at lower concentrations and has higher potency, despite its lower efficacy even at its highest concentration.
- Drugs A and C have the same maximum efficacy even though they vary in their potency.
For therapeutic use, it is also important to distinguish between potency and efficacy. The potency of a molecule, in part, depends on its affinity for a receptor and efficacy depends on the ability of the drug molecule to reach the site of its action.
Why Are Dose-Response Curves Important?
Dose-response curves are key in determining the right concentrations of small molecule agonists or antagonists in experimental designs to restrict variation, aid in data interpretation, and minimize unnecessary repetitions and deaths of animals under study.
Standard nonlinear regression models are used to:
- Plot the dose-response curve
- Measure potency and efficacy
- Reveal potential ligand cooperativity
Once the dose-response curve is generated, the desired concentration for experimentation is selected to produce maximum or partial effects and obtain EC50 data. A maximal effective concentration is typically chosen so the curve starts out flat before reaching 100% effect, thus minimizing unnecessary overdosing, which could cause prozone effect or collateral pharmacological responses. Keep in mind that the more potent the drug, the steeper the dose-response curve will be, and the greater the chance will be for under- or overdosing.
Most drugs are reported with Kd or EC50/IC50 values, which allows a user to gauge the efficacy of the small molecule. However, it is best to generate a dose-response curve for the particular model system to correctly determine appropriate dosing.
ED50
In pharmacological terms, a drug is applied to a system and a resulting physiological or therapeutic response is measured as described by dose-response curves. From a biological perspective, then, one needs to consider what dose may be the most effective to a given percentage of the target population, as well as toxic and potentially lethal dose thresholds.
Thus, the ED50 is defined as the effective dose for 50% of the target population. This measure is specific to the individual experimental design and can be influenced by many chemical and biological factors previously discussed. ED50 values are therefore difficult to compare directly across model systems and one can expect some variation, even among experimental replicates.
Converting ED50 to specific activity units can be done with the following calculation:

Despite the effect of experimental conditions on dosage effectiveness, ED50 (or EC50) values still allow some understanding of efficacy in model systems and serve as a guide to generating dose-response data relevant to the user’s experiments.
An Example of Using EC50 In Research
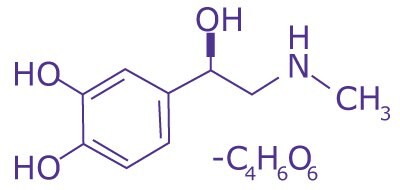
A 2012 study determined the mean EC50 of adrenaline on heart rate and force of contraction of isolated New Zealand white rabbit hearts. They also determined the atenolol concentration that completely blocks the effect of adrenaline. They measured changes in heart rate and contractility after treatment and compared them with baseline values. These data were used to calculate the mean EC50 of adrenaline on heart rate and force of contraction. This EC50 was then used after perfusion of different concentrations of atenolol. Adrenaline (Figure 2) resulted in a stimulatory effect on the heart rate and the amplitude of the heart contraction. The data from this study showed that atenolol concentrations of > 7.5 µg/mL should be used to show if β adrenergic receptors are involved in any newly tested positive inotropic or chronotropic drug’s mechanism of action. 1

Figure 2. 324900 L-(-)-Epinephrine-(+)-bitartrate.Structure of 1-(3,4-Dihydroxyphenyl)-2-(methylamino) ethanol, Adrenaline Bitartrate.
ED50 and Toxicity
ED50 values also are useful when considering what concentration ranges can be used that do not cause toxicity in the model system. To make that assessment, one needs to determine the median toxic dose data (TD50) and perhaps median lethal dose data (LD50), gathered similarly to the ED50. ED50 values that are relatively close to TD50 for a given system indicate that a narrow range of effective concentrations must be used or that the delivery method (e.g., oral, intravenous, or intraperitoneal) must be reconsidered.
Once again, due to the variability inherent in many model biological systems, LD50 values (as with ED50) can be surprisingly variable and unreliable across experimental sets. A low TD50 or LD50 should be of considerable concern when designing drug-related experiments.
Learn other related terms and calculations in our Enzyme Inhibitor Terms and Calculations article.
References
To continue reading please sign in or create an account.
Don't Have An Account?