Determination of Lactose in Dairy Products Using TLC-MS
Introduction
Today food intolerances play a big role in our society. For example, a lot of people are lactose intolerant, usually some more in Asian countries than in Europe or North America. So far, analysis of lactose in foodstuff, especially in dairy products is important for food industries. Foodstuff with a lactose content less than 10 mg/100 g could be labeled as “lactose-free”. Traditionally, analysis is done by use of photometric measurements in single cuvettes, or could also be done in a 96-well plate by use of an enzymatic test kit. Less time consuming and complicated is the use of HPTLC (High performance thin layer chromatography). As shown in this application sheet, milk, yoghurt and an instant sauce are applied onto the TLC plate without a complex sample preparation. Only centrifugation and dilution is necessary. Lactose can be quantified by scanning the TLC plate and subsequently a MS (mass spectrometry) measurement is possible by extracting the analyte directly from the TLC plate with a TLC-MS interface.
Results and Discussion
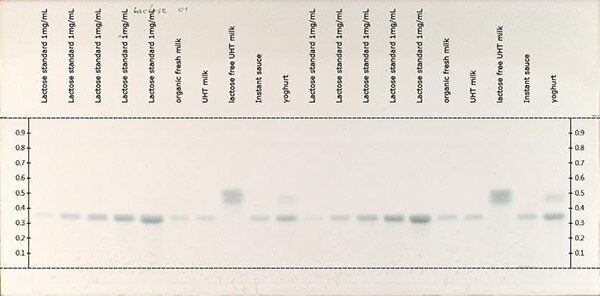
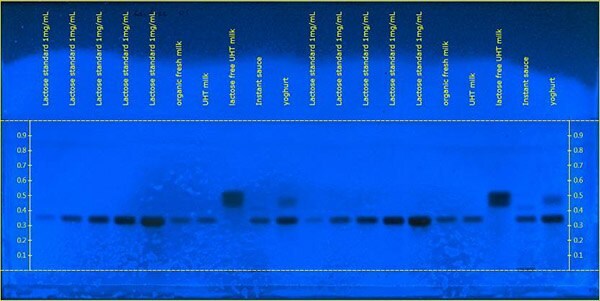
As it is not possible to detect lactose directly under VIS- or UV-light, the plate has to be derivatized with Aniline-di-phenylamine-phosphoric acid reagent before scanning. Figure 1a and 1b show the derivatized plate under white light and at 366 nm.
For quantification a lactose standard with 1.0 mg/mL was used and volumina between 0.1 μL and 4.0 μL were applied on the plate. Details about sample preparation and chromato-graphic data are shown in the tables on next page. Lactose content of the samples is calculated by means of a calibration curve (poly-nominal). Lactose content of the samples is shown in table 1.

Figure 1a.Derivatized plate under white light.

Figure 1b.Derivatized plate at 366 nm.
The mass spectrum in figures 2 and 3 shows three plain peaks, two of lactose with adducts and one of an in-source fragment.

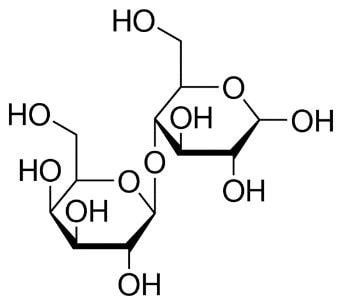
Figure 2.Lactose structure.
![xxx_Lactose in Milchprodukten_20151029 Plain peaks two of lactose - The image displays a mass spectrometry graph with a black background and white grid lines. The x-axis is labeled ‘m/z’ and ranges from 0 to 1,000, while the y-axis is labeled ‘c/s’ and ranges from 0 to 1.7e+6. There are multiple peaks of varying heights across the graph. Three peaks are specifically labeled: one at approximately m/z = 365.2 with the label ‘[M+Na]+’, another at m/z = 405.1 with the label ‘[M+Na+ACN]+’, and a third peak at m/z = 182.2 labeled as ‘In-source fragment’. Each label has an arrow pointing to its corresponding peak.](/deepweb/assets/sigmaaldrich/marketing/global/images/technical-documents/protocols/analytical-chemistry/thin-layer-chromatography/plain-peaks-two-of-lactose/plain-peaks-two-of-lactose.jpg)
Figure 3.Plain peaks two of lactose.
Conclusion
By the use of HPTLC the difference of lactose content in dairy products could be shown. HPTLC is a straightforward and economic method to analyze samples with complex sample matrix, such as milk or yoghurt. By coupling TLC to MS it is possible to identify the different compounds of a sample.

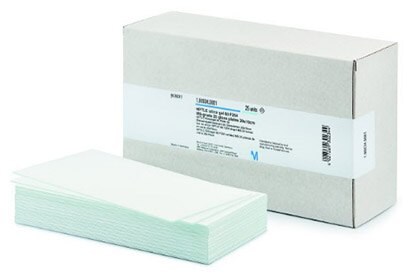
Figure 4.Lactose product.
Materials
To continue reading please sign in or create an account.
Don't Have An Account?