Primer Concentration Optimization Protocol
Optimization of qPCR Conditions
Optimization of qPCR conditions is important for the development of a robust assay. Indications of poor optimization are a lack of reproducibility between replicates as well as inefficient and insensitive assays. The two main approaches are optimization of primer concentration and/or annealing temperatures.
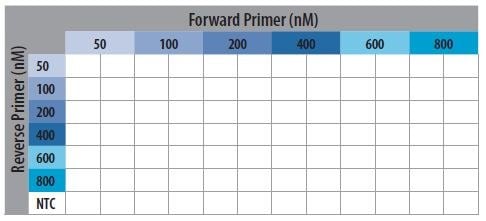
One approach to optimizing primer concentrations is to create a matrix of reactions. This is used to test a range of concentrations for each primer against different concentrations of the partner primer. In the example provided in this protocol, a 6×6 matrix testing six concentrations (e.g., 50 nM to 800 nM) is demonstrated. The quantities stated in this protocol will allow each condition to be run in duplicate.
Equipment used in Primer Concentration Optimization Protocol
- Quantitative PCR instrument
- Laminar flow hood for PCR set up (optional)
Reagents
- Suitable assay template, e.g., cDNA diluted 1:10, gDNA, or synthetic oligo template.
- KiCqStart® SYBR® Green ReadyMix™ (KCQS00/KCQS01/KCQS02/KCQS03—depending on instrument, see Table P4-6 for instrument compatibility).
- PCR grade water: PCR grade water (W1754 or W4502) as 20 mL aliquots; freeze; use a fresh aliquot for each reaction.
- Forward and reverse primers concentration stocks (10 μM working stocks).
• Custom oligos can be ordered at sigmaaldrich.com/oligos.
Supplies
- Sterile filter pipette tips
- Sterile 1.5 mL screw-top microcentrifuge tubes (CLS430909)
- PCR tubes and plates, select one to match desired format:
• Individual thin-walled 200 μL PCR tubes (Z374873 or P3114)
• Plates
- 96-well plates (Z374903)
- 384-well plates (Z374911)
• Plate seals
- ThermalSeal RTS™ Sealing Films (Z734438)
- ThermalSeal RT2RR™ Film (Z722553)
Notes for this Protocol
- cDNA is generated using a random primer or oligo-dT priming method and diluted 1:10 for use, but any suitable, alternative template may be used.
- All samples are run in duplicate according to the plate layout (Figure P13-18).

Figure P13-18.Schematic Representation of the Primer Optimization Plate Layout.
Method
Note: 2.0 μL of each primer will be added to the reaction of 20 μL total volume. For this reason, primer stocks are 10 times the required concentration to achieve the desired final concentration.
1. Using the 10 μM primer stock, make a dilution of both primer stocks to 0.5, 1, 2, 4, 6 and 8 μM as shown in
Table P13-32.
2. Prepare a qPCR master mix according to Table P13-33
(Note: Template and cDNA are added separately in step 5). Mix well.
*Note: Do not add cDNA and primers until step 5.
3. Remove 184.8 μL (for 12× NTC) of master mix from step 2 into a separate tube to use for setting up the
No Template Control (NTC).
4. Add 26.4 μL of dH2O to the NTC mix in step 3 (to replace template).
Note: Set NTC mix on ice for later use.
5. Add 158.4 μL of cDNA template to the remaining master mix from step 2. Set master mix on ice.
6. Add 2.0 μL of appropriate reverse primer dilutions into the PCR plate according to Figure P13-18; also adding
800 nM concentration to the NTC row.
7. Add 2.0 μL of appropriate forward primer dilutions into the PCR plate according to Figure P13-18.
8. Aliquot 16 μL master mix from step 5 into the PCR plate in the wells corresponding to test positions.
9. Aliquot 16 μL master mix from step 4 into the PCR plate for NTC reactions.
10. Seal plates and label. (Make sure labeling does not obscure instrument excitation/detection light path).
11. Run samples according to the two-step protocol in Table P13-34. Steps 1 and 2 are repeated through 40 cycles and followed by a dissociation curve analysis.
Note: Use standard dissociation curve protocol (data collection).
Materials
To continue reading please sign in or create an account.
Don't Have An Account?