Quantification of Methylglyoxal in Manuka Honey - A Simple HPTLC Based Approach
Introduction
Honey - a natural product, is one of the most frequently tested food products. In recent years, manuka honey has gained popularity because of its high antibacterial activity.1 Methylglyoxal (MGO) has been identified as one of the major contributors to its antibacterial activity. MGO is present in high concentrations in manuka honey and is directly responsible for its potency. This makes the manuka honey exclusive and high-priced as compared to the other traditional kinds of honey. Manuka honey from New Zealand usually contains 40 to 800 mg/kg of MGO but can even contain up to 1900 mg/kg.2 To avoid adulteration of manuka honey products, a strict quality regulation regarding its origin, purity, and quality needs to be fulfilled and is a prerequisite for the UMF™ (Unique Manuka Factor) grading.2 It mostly reflects the MGO amount in the honey but also considers other authenticity markers.
In the following application, we focus on the MGO quantification using High-Performance Thin-Layer Chromatography (HPTLC) with subsequent substance confirmation by MS measurement. The high viscosity and high sugar content of honey makes it a very complex and matrix-rich sample for an analysis. Thin-Layer Chromatography (TLC) and High-Performance Thin-Layer chromatography (HPTLC) are convenient, fast, and efficient separation techniques that enable the development of analytical methods without the need for complicated sample preparations or high investments.3 Low cost and short analysis time per sample are given by the parallel analysis of many samples on one plate. Furthermore, the high matrix tolerance of TLC offers additional opportunities to existing routine methods.
Experiment: Materials and Methods
Six different commercially available manuka honey samples were analyzed. MGO shows a mesomeric effect and reacts immediately with water to form either methylglyoxal monohydrate or methylglyoxal dihydrate in aqueous environments.4 Only a small amount of around 1% MGO remains unreacted. Direct detection of MGO in manuka honey is found to be difficult using conventional methods. In this application, MGO is converted to stable 2-methylquinoxaline by derivatizing it with 1,2-phenylenediamine (see Figure 1).5

Figure 1.Reaction scheme of MGO with 1,2-phenylendiamine
The stable form is then used as the reference. For confirmation of the method and determination of the recovery rate regular honey samples have been spiked with MGO and 1,2-phenylenediamine. Other derivatization options were tested but the reaction with 1,2-phenylenediamine performed best. Water and honey matrix were tested to confirm, that the optimized reaction conditions provide reproducible results for both matrices.
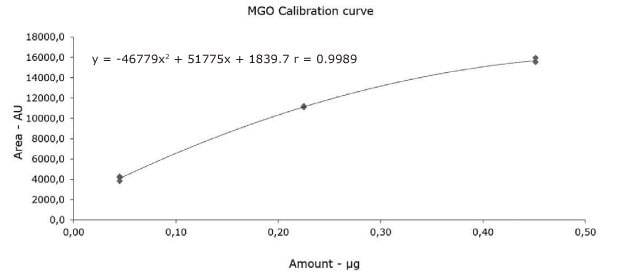
A calibration curve of 2-methylquinoxaline was calculated based on 3 different standard volumes (Table 1 and Figure 2).

Figure 2.Calibration plot with corresponding calibration function
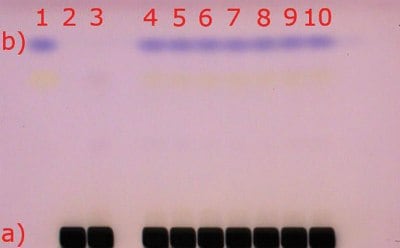
A recovery study was performed using regular honey to simulate honey matrix. It was spiked with a known amount of MGO standard solution, followed by the addition of 1,2-phenylenediamine. The measured (and calculated) MGO amount allowed for the correlation of the actual amount of MGO in the Manuka honey samples. The experimental details of the recovery rate study can be found in Table 2, Table 3, Figure 3, and Figure 4.

Figure 3.Visualization of the plate under visible light (white light); a) matrix compounds after staining with anisaldehyde sulfuric acid (blackareas); b) 2-Methylquinoxaline (blue spot at hRf 80), (reaction product of Methylglyoxal with 1,2-phenylenediamine)

Figure 4.Scan of spiked honey tracks (sample 4 – 10) at 480 nm with CAMAG TLC Scanner 3
All TLC analyses were performed using HPTLC Silica gel 60 F254. The plates were pre-washed with the mobile phase (up to 7 cm) and dried before use.
The standards were prepared by dissolving 100 µL of ~40% aq. MGO solution (exact content known) diluted in 20.0 mL water. 800 μL of this stock solution was further diluted with water to 10.00 mL volume and 0.2% (20 mg) of the reactant 1,2-phenylenediamine was added. All standard solutions were stored at 8 °C for two days before use to achieve reproducible reaction of MGO with 1,2-phenylenediamine. Longer storage times (>3 days) lead to partly degradation of 2-methylquinoxaline.
Honey sample solutions of 100 mg/mL in case of sample numbers 1, 3, 5, and 150 mg/mL in case of honey samples 2, 4 and 6 were applied with a higher volume due to the expected lower amount of MGO. To each sample 0.2% of 1,2-phenylenediamine was added, e.g., sample 1, 4.0 g honey diluted in 40 mL solution of water / ethanol in 3:2. To the solution 0.2% (80 mg) of the reactant 1,2-phenylenediamine was added. Before using the samples, they needed to be stored at 8 °C for two days to complete the reaction.
The samples and standards were applied as spots in an area of 5 x 3 mm.2 This step is necessary because of the high matrix and high application volumes of the honey samples. The plate was developed, dried, and then derivatized by dipping in an anisaldehyde-sulfuric acid reagent. Blue spots of 2-methylquinoxaline (product of the reaction of MGO with 1,2‑phenylenediamine) appeared at hRf 80. Daylight examination and scanning of the plate at 480 nm were carried out for quantification. Experimental results are shown in Figure 5 and Table 4.

Figure 5.Visualization of the plate under visible light (white light); a) matrix compounds after staining with anisaldehyde sulfuric acid (black areas); b) 2-methylquinoxaline (blue spot at hRf 80), (reaction product of methylglyoxal with 1,2-phenylenediamine)
A separate plate without staining was used for MS measurement. The coupling to MS was performed on an elution-based approach, that utilized a TLC-MS interface. This enabled the dissolution of the analyte from the silica plate at the zone of hRf 80 by a solvent and a transfer to the mass spectrometer in the liquid phase. This additionally confirmed the spot identification of the MGO derivative 1-methylquinoxaline.6
Results and Discussion
As demonstrated, MGO can be identified and quantified in different honey samples within the concentration range of 50 mg to 600 mg/kg. The conversion of MGO into the more stable compound 2-methylquinoxaline allows for an easy evaluation of the MGO content. The recovery study showed a detectable MGO amount of around 90%. The correlated MGO amount in manuka samples was calculated accordingly. One of the samples (sample 1) showed a lower MGO content than indicated by the supplier. This might be because of the degradation of the MGO during storage. Sample 2 and sample 6 only showed MGO concentrations of 50 and 100 mg/kg. These manuka honey samples are considered of lower quality. Although no indication of MGO concentration was provided by the supplier.
Conclusion
The analysis of MGO in a complex and challenging food matrix like honey was described. Target analyte could be easily separated and detected without time-consuming and labor-intensive sample preparation. The flexible instrument set-up enabled a combination with the MS measurements.
Screening and method development capabilities were shown by the application of 27 tracks in one plate (honey samples and standard solutions). The study clearly emphasized different honey qualities (referring to MGO content) on the market. Though the analysis of MGO is challenging, MGO content could be identified in the expected range.
To summarize, a fast, cheap, and simple quantification of methylglyoxal can be accomplished with HPTLC. This application demonstrates the main advantages of the method, such as quick sample preparation, high-matrix tolerance, and high-throughput.
Related Application Categories
Chemical Analysis for Food and Beverage Testing
Thin Layer Chromatography
See also information about the TLC Explorer Documentation System, a superior instrumental and software solution for reliable TLC plate analysis.
Materials
TLC-MS
References
To continue reading please sign in or create an account.
Don't Have An Account?