Identification of Atenolol and Chlorthalidone in Tablets by TLC acc. to USP and Quantification Using the TLC Explorer
Valanka D’Silva
R&D APAC Lab, Jigani, Bangalore, India
Abstract
This study presents a method for the identification of atenolol and chlorthalidone in tablet formulations using thin layer chromatography (TLC) as per the USP monograph. The TLC Explorer system was employed for enhanced digital documentation and automated evaluation, facilitating also quantitative analysis and by that extended the use of TLC for this application. Results indicate that the test samples exhibited Rf values comparable to standard solutions, confirming identity. Quantitative assessments yielded concentrations within 97.6% to 102.6% of nominal values, indicating the method's applicability. This application underscores the TLC Explorer's efficacy in pharmaceutical TLC analysis and documentation.
Section Overview
Introduction
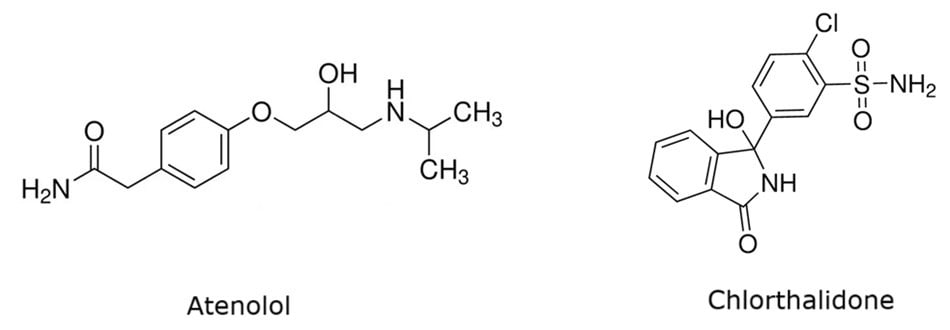
Figure 1.Chemical structures of atenolol and chlorthalidone.
Atenolol and chlorthalidone (Figure 1) combination tablets are used to treat high blood pressure (hypertension). Atenolol (2-[p-[2-hydroxy-3-(isopropylamino)propoxy]phenyl]acetamide) is a cardio-selective beta blocker that works by affecting the response to some nerve impulses in the heart. As a result, the heart beats slower and decreases the blood pressure. Chlorthalidone (2-chloro-5-(1-hydroxy-3-oxoisoindolin-1-yl)benzene sulfonamide) is a diuretic that reduces the amount of water in the body by increasing the flow of urine, which helps to lower blood pressure.1
The United States Pharmacopeia (USP) monograph for atenolol and chlorthalidone tablets lists thin layer chromatography (TLC) as one of the methods for the identification test.2 In many pharmacopeial methods, TLC is a frequently cited technique for identity testing. HPTLC, a high-performance version of TLC and often used with automation, is a robust, reliable, rapid, and inexpensive tool used in qualitative and quantitative analysis of pharmaceutical compounds. This technique delivers chromatographic separations/fingerprints that can be visualized for identification/quantification and saved as electronic images for documentation.3-4
In this application note, the USP monograph specified identification test of atenolol and chlorthalidone in tablets by TLC is performed on the new TLC Explorer documentation system (Figure 2) that is also used to extend this method to a quantitative evaluation by video densitometry.
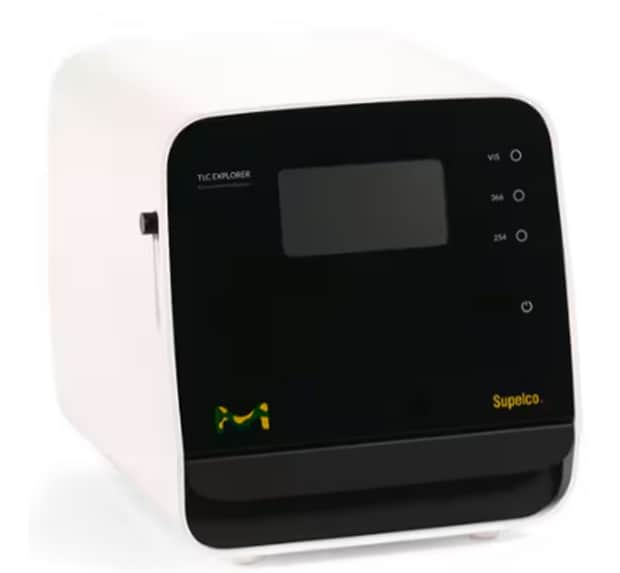
Figure 2.TLC Explorer.
The TLC Explorer documentation system enables the digital and automated evaluation of TLC plates, enhancing the efficiency and accuracy of thin layer chromatography analysis. The device offers three illumination modes using LED light sources—white light (VIS), UV-A (366 nm), and UV-C (254 nm) – for the detection and fast measurement of the compounds of interest. The software offers special features like automated track recognition, simultaneous measurement of multiple plates and background signal correction. Overall, the TLC Explorer offers accurate TLC imaging for reliable densitometric measurements, enabling quantitative analysis and reliable data interpretation.
Experimental
Reagent Preparation
Mobile phase: Dissolve 6.80 mL of ammonia solution 25% in 100 mL of water to obtain 1 N ammonium hydroxide. Mix 40 mL of this solution with 200 mL of n-butyl alcohol to obtain a mixture of n-butyl alcohol and 1 N ammonium hydroxide (5:1, v:v).
Standard Preparation
Atenolol
- Standard stock solution 1 (50 mg/mL of atenolol): Weigh and dissolve 125 mg of atenolol in 2.5 mL of methanol.
- Standard solution 1 (20 mg/mL atenolol): Dilute 400 µL of standard stock solution 1 to 1000 µL with methanol.
Chlorthalidone
- Standard stock solution 2 (25 mg/mL chlorthalidone): Weigh and dissolve 62.5 mg of chlorthalidone in 2.5 mL of methanol.
- Standard solution 2 (10 mg/mL chlorthalidone): Dilute 400 µL of standard stock solution 2 to 1000 µL with methanol.
Standard mix solutions I-VI
Prepare a total of six standard solutions (nos. I-VI) by pipetting 40 μL, 100 μL, 200 μL, 300 μL, 400 μL, and 440 μL each of standard stock solution 1 and standard stock solution 2 into six separate 2 mL vials. Add methanol to get to a final volume of 1 mL. The resulting solutions contain 2.0, 5.0, 10.0, 15.0, 20.0, and 22.0 mg/mL of atenolol and 1.0, 2.5, 5.0, 7.5, 10.0, and 11.0 mg/mL of chlorthalidone, respectively.
Sample Preparation
Sample tablets were used with an atenolol-to-chlorthalidone content ratio of 1:2.
- Test solution I (for identification): Weigh and shake a quantity of powdered combination tablets, equivalent to 50 mg of atenolol (corresponding to 25 mg of chlorthalidone), with 2.5 mL of methanol for 15 minutes, and filter through a 0.45 µm PVDF membrane. Nominal resulting concentration of 20 mg/mL atenolol and 10 mg/mL chlorthalidone.
- Test solution II (for quantification): Weigh and shake a quantity of powdered combination tablets, equivalent to 25 mg of atenolol (corresponding to 12.5 mg of chlorthalidone), with 2.5 mL of methanol for 15 minutes, and filter through a 0.45 µm PVDF membrane. Nominal resulting concentration of 10 mg/mL atenolol and 5 mg/mL chlorthalidone.
- Recovery test solutions I-III: Prepare three samples by shaking a quantity of powdered tablets, equivalent to 25 mg of atenolol (corresponding to 12.5 mg of chlorthalidone), spiked with 125 μL, 250 μL, and 500 μL each of standard stock solution 1 and standard stock solution 2 for 15 minutes. Add methanol to get to a final volume of 2.5 mL and filter the solutions.
Instrument Parameters
Results
The identification of atenolol and chlorthalidone in tablets performed according to the USP monograph on the TLC Explorer under UV 254 nm and UV 366 nm is demonstrated in Figure 3. It additionally shows the calibration and recovery experiments performed on the TLC Explorer. Table 2 summarizes the obtained chromatographic results (Rf values). As required by the USP monograph for the identification, the principal spots obtained from the test solution (track 3) correspond to the Rf value size and intensity of the respective standard solutions (tracks 1 & 2).
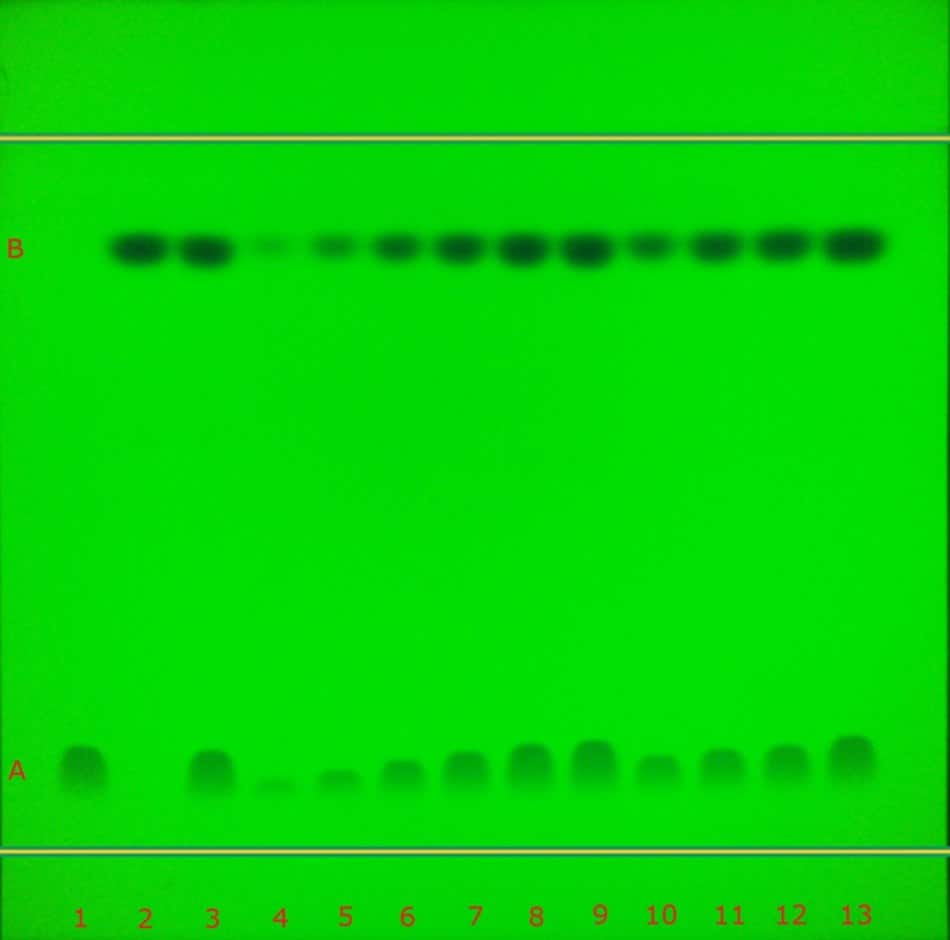
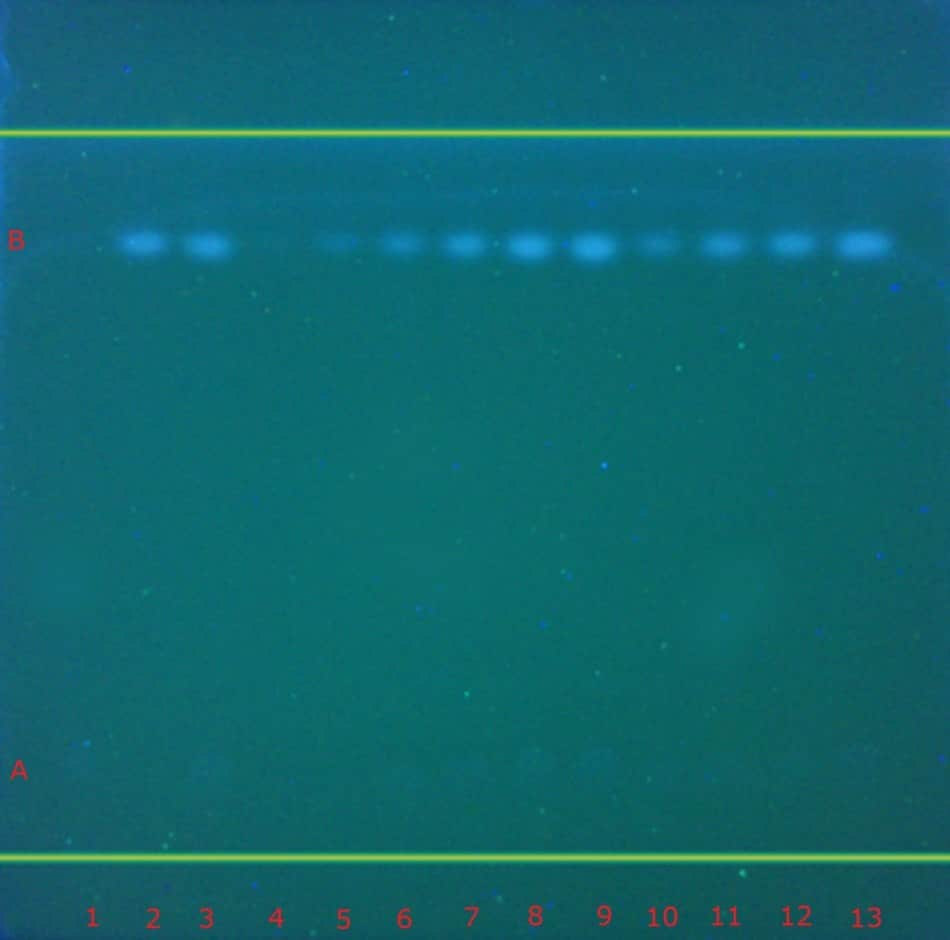
Figure 3. TLC chromatogram demonstrating the identification studies (track 1-3), calibration studies (tracks 4-9), test sample (10) and recovery studies (tracks 11-13) of atenolol (A) and chlorthalidone (B) in tablets under UV 254 nm (left) and UV 366 nm (right) by the TLC Explorer.
Calibration
The results of the calibration experiments utilizing standard mix solutions I-VI and the calibration function of the TLC Explorer unit are displayed in Figures 4 & 5 Table 3 (for atenolol), and Figure 6 & 7 and Table 4 (for chlorthalidone).
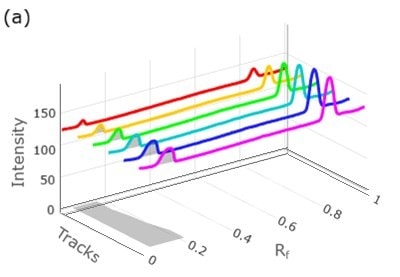

Figure 4. 3D densitogram (left, tracks 4 to 9) and 2D densitogram (right) demonstrating the calibration studies for atenolol utilizing standard mix solutions I-VI.
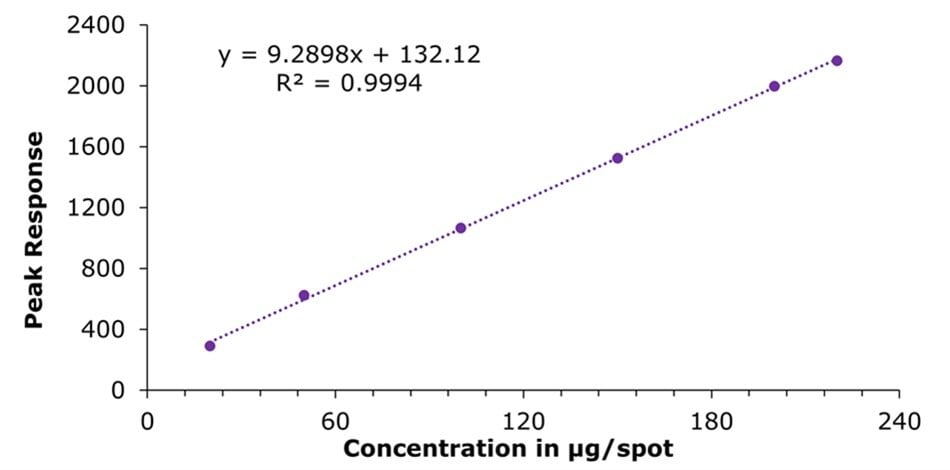
Figure 5.Calibration curve obtained for atenolol using standard mix solutions I-VI
(c = 20.0, 50.0, 100.0, 150.0, 200.0 and 220.0 μg/spot).
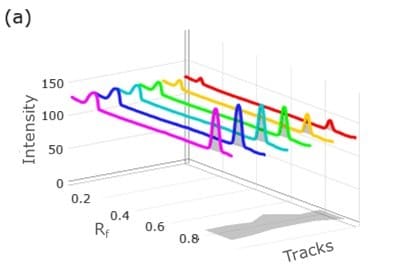

Figure 6. 3D densitogram (left, tracks 9 to 4) and 2D densitogram (right) demonstrating the calibration studies for atenolol utilizing standard mix solutions I-VI.
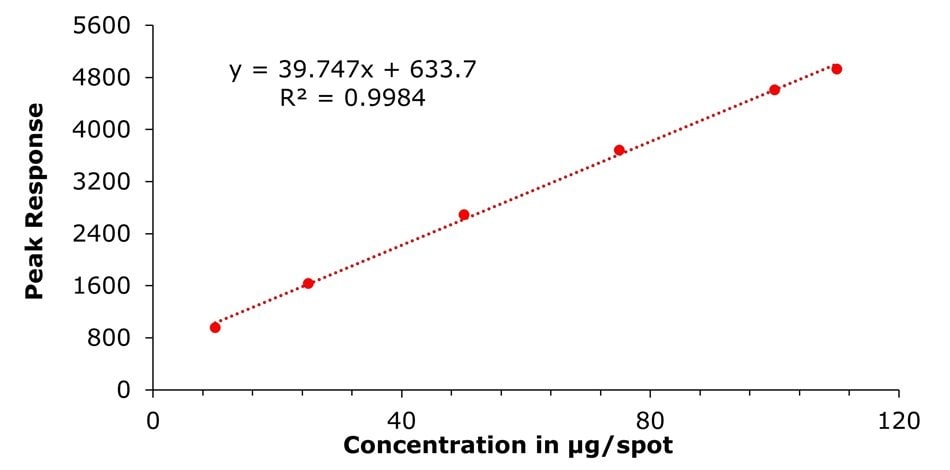
Figure 7.Calibration curve obtained for chlorthalidone using standard mix solutions I-VI
(c = 10.0, 25.0, 50.0, 75.0, 100.0 and 110.0 μg/spot).
The determined sensitivities, LODs, and LOQs were 7.23 and 21.92 µg/spot for atenolol and 5.97 and 18.08 µg/spot for chlorthalidone, respectively. These represent concentrations in the applied sample solutions (10 µL) of 0.72 and 2.19 mg/mL for atenolol and of 0.59 and 1.80 µg/mL for chlorthalidone.
Recovery
The results of the spike recovery experiments utilizing recovery test solution I-III are displayed in Table 5 and Table 6 and were found to be in the range of 90.03 to 98.6%.
Results Test Sample
Quantification of the test sample II by applying the established calibration curve led to resulting concentrations of 97.64 µg/spot for atenolol and 51.32 µg/spot for chlorthalidone (Table 7), representing 97.64 % and 102.64 % of the respective nominal concentrations in the applied solutions (10 µL) of 10 mg/mL atenolol and 5 mg/mL chlorthalidone.
Conclusion
A method was applied following the USP monograph specified identification test of atenolol and chlorthalidone in tablets using TLC. The assessment and the documentation of the chromatographic results were done with the TLC Explorer documentation system. The principal spots in the chromatogram obtained from the test solution were similar in Rf value, size, and intensity to the principal spot in the chromatogram obtained with the standard solution as required by the monograph. Additionally, beyond the USP monographs TLC use for identification, the method was extended to a quantitative assessment for the two analytes using the quantification option of the TLC Explorer. The quantification of the test sample resulted in 97.6 -102.6% agreement with the nominal concentrations.
This application note demonstrates that the TLC Explorer documentation system serves as an efficient TLC visualizer, enabling data capture, track identification, and Rf value calculation.
Find more information on the TLC Explorer Documentation System.
Reference Materials
References
To continue reading please sign in or create an account.
Don't Have An Account?