Clozapine Assay HPLC Method According to USP Monograph
Ajay Kaparwan
Merck Life Science Pvt Ltd, R&D, APAC
Abstract
A Clozapine HPLC assay method following the USP monograph is demonstrated using a Purospher® Star RP-8 endcapped column. The developed method complies with the system and method suitability criteria for the quantification and identification of clozapine, as per the USP monograph method. In this study, an assay of clozapine in an API sample as well as a tablet formulation was performed, showing both met the USP monograph limits.
Section Overview
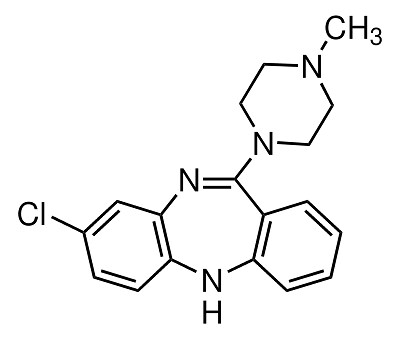
Clozapine
Introduction
Clozapine is a psychiatric medication used for the treatment of schizophrenia and schizoaffective disorders for patients who do not respond well to other antipsychotics or, are unable to tolerate other drugs.1 It is also used for the treatment of psychosis in Parkinson's disease.2,3
Here a clozapine HPLC assay following the USP monograph4 is demonstrated using a Purospher® Star RP-8 endcapped column. The method is compared against the system suitability criteria for the identification and quantification of clozapine according to the USP monograph
Experimental
Standard and Sample preparation
Standard and sample solutions were prepared according to the following procedures:
- Diluent: methanol in water (80:20 v/v)
- Standard solution (0.1 mg/mL): Weigh 10 mg of USP clozapine RS into a 100 mL volumetric flask. Add diluent with intermittent swirling to dissolve. Sonicate the solution for 20 minutes and top to volume with diluent.
- System suitability stock solution (0.1 mg/mL): Transfer 10 mg of USP clozapine RS to a suitable container, add 5 mL of 0.1 N HCl, and heat for 2 hours at 90 °C. Transfer this solution to a 100 mL volumetric flask, add 15 mL of water, and dilute with methanol to volume.
- System suitability solution: System suitability stock solution and standard solution (50:50)
- Sample solution (Clozapine API): Weigh 10 mg of clozapine API into a 100 mL volumetric flask. Add diluent with intermittent swirling to dissolve. Sonicate the solution for 20 minutes and top to volume with diluent.
- Sample solution (Clozapine Tablet): Weigh and crush 10 clozapine tablets and transfer powdered sample equivalent to 25 mg of clozapine to a 250 mL volumetric flask. Add diluent with intermittent swirling, sonicate for 20 minutes, and top up with diluent. Filter the resulting solution through a 0.45 µm PVDF syringe filter.
HPLC-UV Analysis
Analysis by HPLC-UV was performed on a Purospher® STAR RP-8 endcapped column (Table 1).
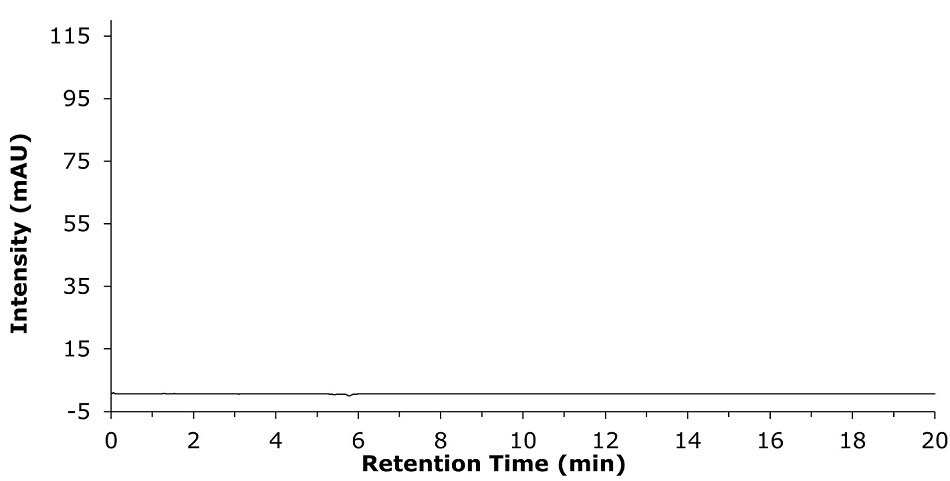
Figure 1.Blank chromatogram for the clozapine assay, using 80% v/v of methanol in water as diluent.
System Suitability
The system repeatability is demonstrated by six replicates (Table 2) of 0.1 mg/mL of Clozapine USP RS solution as per the USP method as shown in the single representative chromatogram (Figure 2).
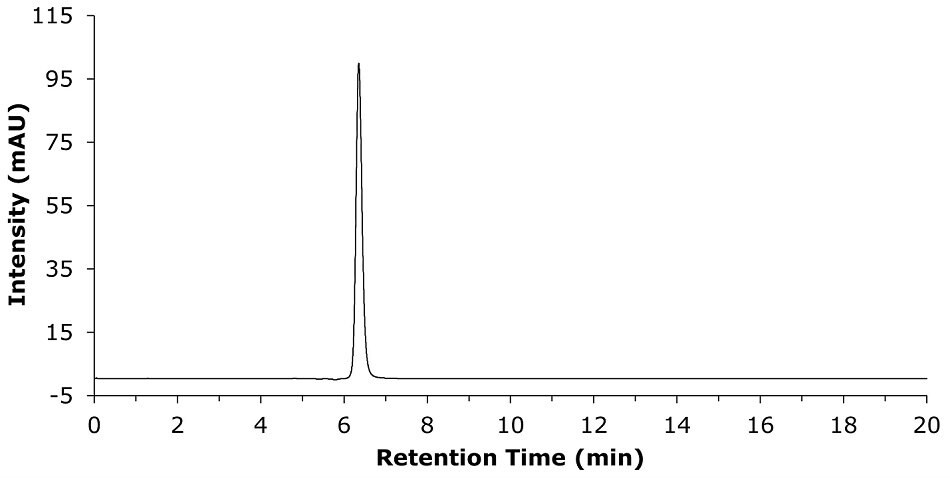
Figure 2.Representative repeatability study chromatogram for a 0.1 mg/mL of clozapine standard solution prepared in 80% of methanol in water, as diluent.
Method Suitability
The method suitability test is performed to show the suitability of the column to perform the assay study of clozapine as recommended in the USP monograph for the clozapine assay. For the method suitability determination, a 50:50 mix of the system suitability stock solution and the standard solution was used as described in the monograph (see above).
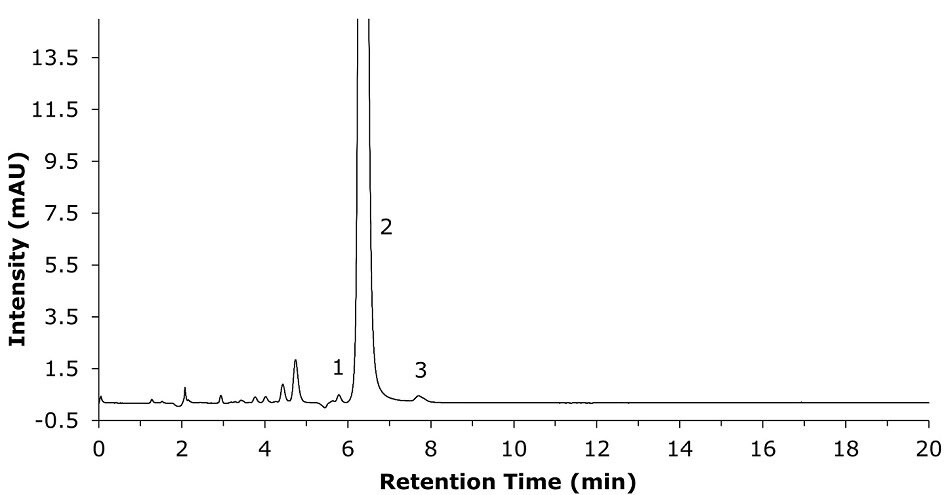
Figure 3.Chromatogram for system suitability solution (50:50 system suitability stock solution and standard solution). Observation of unknown degradation peak (1), clozapine peak (2), and unknown degradation peak (3).
Calibration
The calibration of clozapine was performed in the concentration range of 10 to 200 μg/mL (Table 4) and resulted in a linearity value R2 of 0.999 (Figure 4).
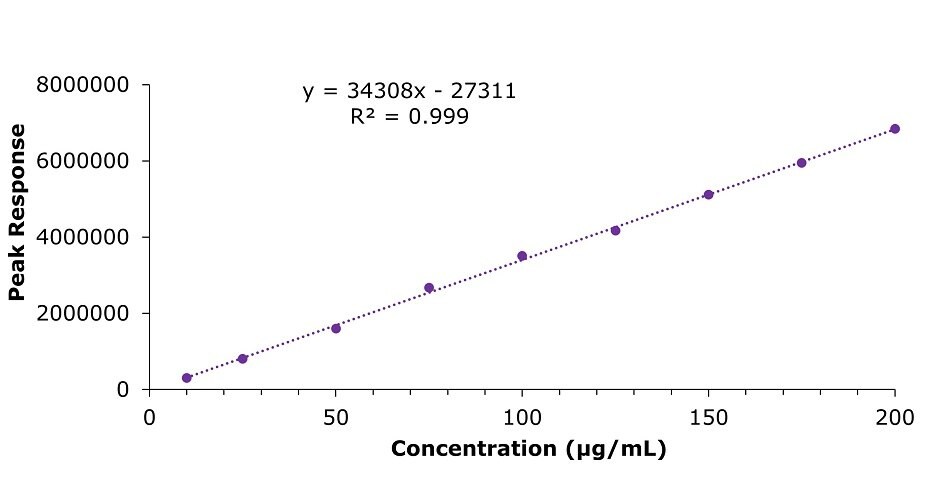
Figure 4.Calibration curve in the concentration range of 10 µg/mL to 200 μg/mL for Clozapine USP RS, prepared in 80% v/v of methanol in water (diluent) as per USP monograph assay method.
Sample Measurements
Chromatograms acquired for the API and the tablet formulation samples are shown in Figures 5 & 6. The assay results are provided in the summary Table 5.
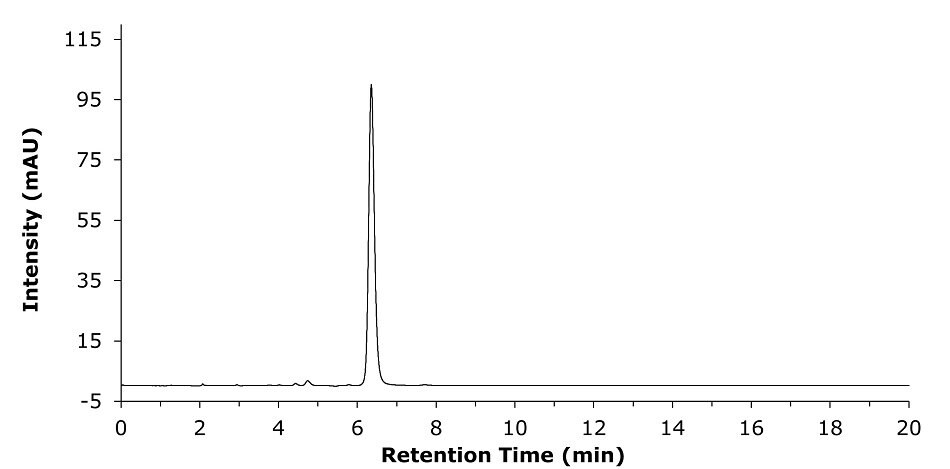
Figure 5.Representative repeatability study chromatogram for a 0.1 mg/mL of clozapine API sample solution in diluent.
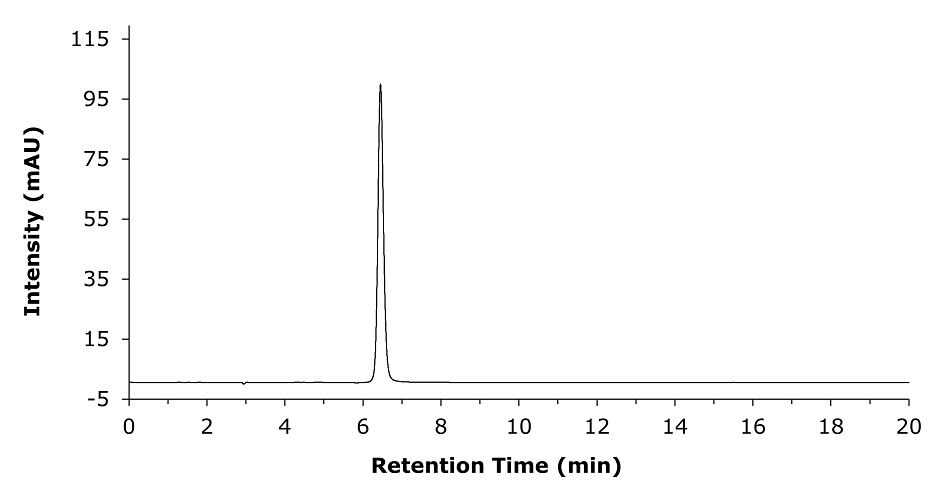
Figure 6.Representative chromatogram for a 0.1 mg/mL of clozapine sample solution prepared from commercial tablet formulation in diluent.
Summary of Suitability and Assay Results
The results for the suitability test and the sample assay are summarized in Table 5.
Conclusion
The displayed method showed that the Purospher® STAR RP-8 endcapped, 250 x 4.6 mm, 5 µm column is able to meet the system and method suitability criteria mentioned in the USP monograph for the determination of % assay of clozapine present in an API sample and was also applied to a tablet formulation. The method showed to be linear (R2 0.999) over the concentration range of 10 to 200 µg/mL of clozapine. The %RSD for the 0.1 mg/mL standard solution was 0.13%, and the tailing factor showed to be 1.1. The resolution between clozapine and the nearest adjacent peak was 2.59. The limit of detection (LOD) and the limit of quantification (LOQ) for clozapine were 7.42 and 22.51 µg/mL, respectively.
References
To continue reading please sign in or create an account.
Don't Have An Account?