
TLC Analysis of L-Lysine in Formulated Syrup on HPTLC Silica Gel 60 F254
Materials
accessory
related product
CONDITIONS
sample preparation
Test solution: Dissolve 10 mL of syrup in 100 mL water. Pipette out 1 mL of the stock solution and dilute to 10 mL with water.
sample addition
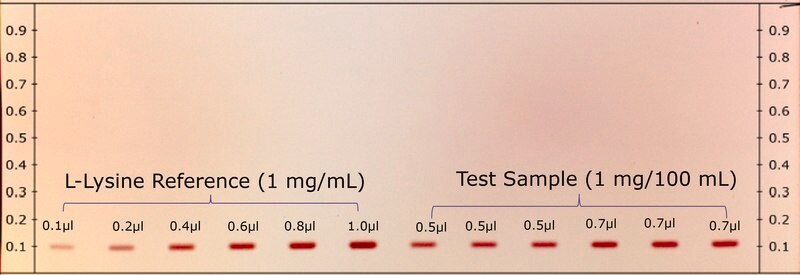
Reference – 0.1 to 1.0 µL
Sample – 0.5 µL and 0.7 µL
plate
Silica Gel 60 F254 F 20x10 cm
mobile phase
Concentrated ammonia: n-propanol (30:70) v/v
migration distance
8 cm
drying
Heat at 110 °C for 3 minutes.
derivatization
Spray with ninhydrin solution
detector
Scan at 520 nm
Description
General description
L-Lysine is an alpha amino acid that is used in biosynthesis. The human body cannot synthesize lysine. It is essential for humans and must be obtained from the diet. Due to its importance in several biological processes, a lack of lysine can lead to several disease states, including defective connective tissues, impaired fatty acid metabolism, anemia, and systemic protein/energy deficiency.
The present study illustrates quantitative determination of L-lysine in formulated syrup (containing L-lysine, vitamins, sugar, and colorant) using HPTLC plates (Silica Gel 60 F254). Analysis results show L-lysine content in agreement with the declared value on the product label.
Analysis Note
The principal spot in the chromatogram obtained with the test solution is similar in position, color & size to the principal spot in the chromatogram obtained with the reference solution.
Retardation factor for reference solution and test solution is 0.10 & 0.10, respectively, indicating similar position and colour.
The polynomial calibration curve displays a correlation coefficient of 0.9995 over a concentration range from 100 ng to 800 ng.
Commercial L-lysine syrup containing sample tested as per the illustrated method shows L-Lysine concentration 74.23 mg/g against the label claim concentration 75 mg/g.
R = 0.9995
Other Notes
App_199