Merck
CN
HomeBiopharmaceutical CharacterizationMonoclonal Antibody Titer Determination Using a Chromolith® WP 300 Protein A Wide Pore Monolithic Silica HPLC Column

Monoclonal Antibody Titer Determination Using aChromolith® WP 300 Protein A Wide PoreMonolithic Silica HPLC Column

Analyzing Cetuximab, Trastuzumab, and Universal Antibody Standard by HPLC-UV

Gisela Jung, R&D Scientist, Benjamin Peters R&D Lab Head, Cory Muraco, Biomolecule Workflows Product Manager

Merck

Article from Analytix Reporter - Issue 16

Analyzing Cetuximab, Trastuzumab, and Universal Antibody Standard by HPLC-UV

Introduction

Monoclonal antibod (mAbs) manufacturing is  often done by fermentation processes where the amount and quality of the expressed product are essential and are monitored via affinity chromatography. This antibody titer determination can be carried out by using a Chromolith® WP 300 Protein A HPLC column.

In this work, bind and elute experiments are shown for three different monoclonal antibodies: cetuximab, trastuzumab, and the universal antibody standard, human, on a Chromolith® WP 300 Protein A column (Figure 1).
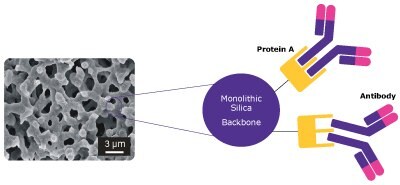
The image's left side provides a microscopic view of the Chromolith® WP 300 Protein A column, showcasing its bimodal pore structure in subdued grey tones. The scale is indicated as 3 µm. On the right side, an illustration demonstrates the precise alignment of the antibody, depicted with two long arms and two short arms, fitting seamlessly at a specific site on Protein A.

Figure 1.Schematic of the antibody interaction in the bimodal pore structure of the Chromolith® WP 300 Protein A column.

All three immunoglobulin variants were analyzed with the addition of a matrix-standard to demonstrate the ability of this column to handle high matrix load.


Experimental

Three mAbs in standard solutions and three simulated matrix samples were prepared using SILu™ Lite SigmaMAb standards and the matrix standard, SigMatrix Serum diluent, a 6% recombinant HSA (Human Serum Albumin) in phosphate-buffered saline (PBS) solution, pH 7.4, that can be used as a blank or matrix/diluent for proteinaceous analytes in LC-MS/MS calibrators, controls, or samples. The standard solutions and matrix samples were analyzed on a 25 x 2 mm I.D. Chromolith® WP 300 Protein A column under the conditions shown in Table 1.
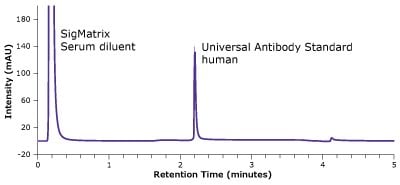
Table 1.Conditions for titer determination of mAbs by HPLC-UV

Results

Analysis of Universal Antibody Standard, Human

A chromatogram plotted between intensity (measured in mAU) on y-axis and retention time (measured in minutes) on x-axis. It clearly depicts a peak for SigMatrix Serum diluent at 0.22 minutes and a peak for Universal Antibody Standard, human at 2.2 minutes. These observations were recorded during the analysis of the antibody in a matrix standard employing a Chromolith® WP 300 Protein A column.

Figure 2.Analysis of SILu™Lite SigmaMAb Universal Antibody Standard, human, in matrix on a Chromolith® WP 300 Protein A (25 x 2 mm).
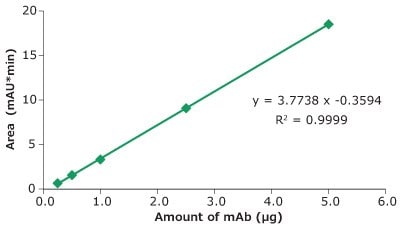
Table 2.Chromatographic data for analysis of SigmaMAb Universal Antibody Standard, human, in matrix
A graphical representation is presented, plotting peak area (measured in mAU*min) on the y-axis against the amount of monoclonal antibody (mAb) in micrograms on the x-axis. The graph displays a straight green line, indicating the linear correlation between the peak area, measured using the LC-MS/MS technique, and the injected amount of the Universal Antibody Standard, human. Furthermore, the linear equation is provided as y = 3.7738x – 0.3594, accompanied by an R² value of 0.9999.

Figure 3.Linearity, Universal Antibody Standard, human, peak area vs injected amount of mAb.
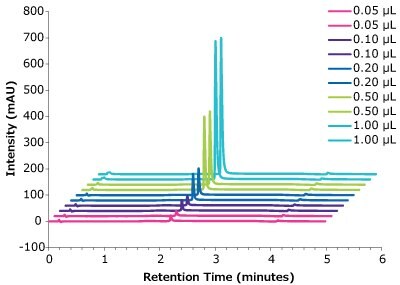
Table 3.Linearity data for Universal Antibody Standard, human, using different injection volumes
A graphical plot with intensity (measured in mAU) on y-axis and retention time (measured in minutes) on x-axis showing an overlay of chromatograms obtained at various injection volumes (with 2 repetitions for each injection volume) illustrating the correlation between intensities of the peaks obtained for Universal Antibody Standard, human, demonstrating reproducibility of retention time and peak height.

Figure 4.Linearity, Universal Antibody Standard, human, peak intensity with different injection volumes vs retention time.
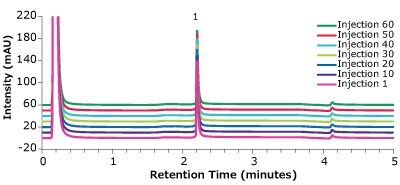
A graphical plot with intensity (measured in mAU) on y-axis and retention time (measured in minutes) on x-axis showing an overlay of chromatograms depicting reproducibility of the retention time and corresponding intensities obtained for the Universal Antibody Standard, human, in a matrix standard, using a Chromolith® WP 300 Protein A column at 1 to 60 injections (7 steps shown).

Figure 5.Analysis of Universal Antibody Standard, human (1), in matrix on a Chromolith® WP 300 Protein A (25 x 2 mm) – multiple injections.
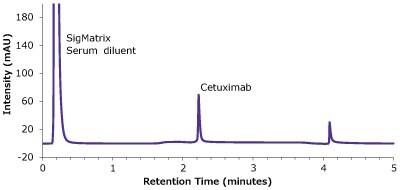
Table 4.Chromatographic data for multiple injections of Universal Antibody Standard, human, in matrix solution

Analysis of Cetuximab

A chromatogram plotted between intensity (measured in mAU) on y-axis and retention time (measured in minutes) on x-axis. It clearly depicts a peak for SigMatrix Serum diluent at 0.21 minutes and a peak for cetuximab at 2.22 minutes. These observations were recorded during the analysis of the antibody in a matrix standard employing a Chromolith® WP 300 Protein A column.

Figure 6.Analysis of SILu™Lite Cetuximab in matrix on Chromolith® WP 300 Protein A (25 x 2 mm).
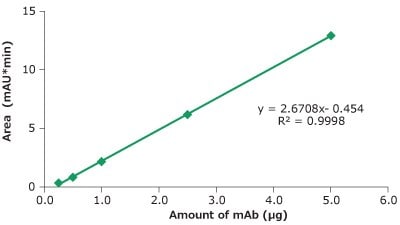
Table 5.Chromatographic data for analysis of cetuximab in matrix
A graphical representation is presented, plotting peak area (measured in mAU*min) on the y-axis against the amount of monoclonal antibody (mAb) in micrograms on the x-axis. The graph displays a straight green line, indicating the linear correlation between the peak area, measured using the LC-MS/MS technique, and the injected amount of cetuximab. Furthermore, the linear equation is provided as y = 3.4007x – 1.0368, accompanied by an R² value of 0.9997.

Figure 7.Linearity cetuximab peak area vs injected amount of mAb.
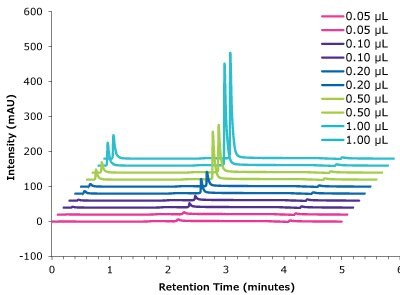
Table 6.Linearity data for cetuximab using different injection volumes.
A graphical plot with intensity (measured in mAU) on y-axis and retention time (measured in minutes) on x-axis showing an overlay of chromatograms obtained at various injection volumes (with 2 repetitions for each injection volume) illustrating the correlation between intensities of the peaks obtained for Cetuximab, demonstrating reproducibility of retention time and peak height.

Figure 8.Linearity cetuximab peak intensity with different injection volumes vs retention time.
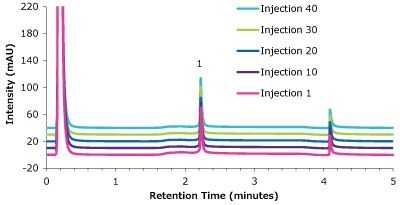
A graphical plot with intensity (measured in mAU) on y-axis and retention time (measured in minutes) on x-axis showing an overlay of chromatograms obtained for cetuximab, in a matrix standard, using a Chromolith® WP 300 Protein A column at 1 to 40 injections (5 steps shown)

Figure 9.Analysis of cetuximab (1) in matrix on a Chromolith® WP 300 Protein A (25 x 2 mm) - multiple injections.
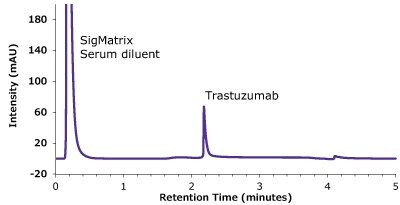
Table 7.Chromatographic data for multiple injections of cetuximab in matrix solution.

Analysis of Trastuzumab

A chromatogram plotted between intensity (measured in mAU) on y-axis and retention time (measured in minutes) on x-axis. It clearly depicts a peak for SigMatrix Serum diluent at 0.22 minutes and a peak for trastuzumab at 2.18 minutes. These observations were recorded during the analysis of the antibody in a matrix standard employing a Chromolith® WP 300 Protein A column.

Figure 10.Analysis of SILu™ Lite Trastuzumab in Matrix on Chromolith® WP 300 Protein A (25 x 2 mm).

Table 8.Chromatographic data of analysis of trastuzumab in matrix.
A graphical representation is presented, plotting peak area (measured in mAU*min) on the y-axis against the amount of monoclonal antibody (mAb) in micrograms on the x-axis. The graph displays a straight green line, indicating the linear correlation between the peak area, measured using the LC-MS/MS technique, and the injected amount of trastuzumab. Furthermore, the linear equation is provided as y = 2.6708x – 0.454, accompanied by an R² value of 0.9998.

Figure 11.Linearity trastuzumab peak area vs injected amount of mAb.
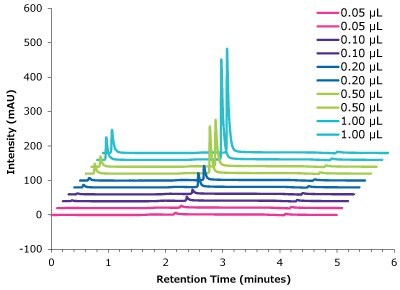
Table 9.Linearity data for trastuzumab using different injection volumes.
A graphical plot with intensity (measured in mAU) on y-axis and retention time (measured in minutes) on x-axis showing an overlay of chromatograms obtained at various injection volumes (with 2 repetitions for each injection volume) illustrating the correlation between intensities of the peaks obtained for Trastuzumab, demonstrating reproducibility of retention time and peak height.

Figure 12.Linearity trastuzumab peak intensity with different injection volumes vs retention time.
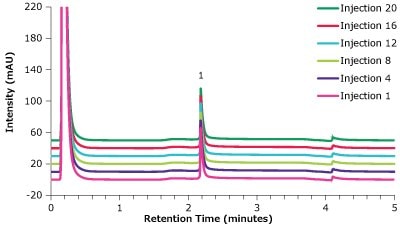
A graphical plot with intensity (measured in mAU) on y-axis and retention time (measured in minutes) on x-axis showing an overlay of chromatograms obtained for trastuzumab, in a matrix standard, using a Chromolith® WP 300 Protein A column at 1 to 20 injections (6 steps shown)  Table 9. Chromatographic data for multiple injections of trastuzumab in matrix solution

Figure 13.Analysis of trastuzumab (1) in matrix on a Chromolith® WP 300 Protein A (25 x 2 mm) - multiple injections.

Table 10.Chromatographic data for multiple injections of trastuzumab in matrix solution.

Conclusion

It could be shown that all three antibodies (universal antibody standard, human, cetuximab, trastuzumab) can be analyzed reproducibly using the Chromolith® WP 300 Protein A column.

A fast separation, within about 2 min, can be achieved, with high linearity values, for a broad range of injected sample amounts.

Furthermore, it was demonstrated that the column can handle a high matrix load for multiple injections. A standardized matrix was used for this study (SigMatrix Serum diluent).

Related Products
Loading
Sign In To Continue

To continue reading please sign in or create an account.

Don't Have An Account?