Green Tea Analysis for Determination of Glyphosate, Glufosinate, and AMPA by LC-MS/MS with QuEChERS Cleanup
Jack Wang
R&D APAC lab, Shanghai, China
Abstract
A QuEChERS-liquid chromatography-tandem mass spectrometry (LC-MS/MS) method was established for the determination of glyphosate, glufosinate, and AMPA in green/fresh tea. The samples were extracted by acetonitrile/water solution, and the extracts cleaned up by QuEChERS using a dedicated adsorbent mix for green samples. Analysis and quantification were performed by LC-MS/MS with multi-reaction monitoring mode (MRM) and matrix external standard method. Glyphosate, glufosinate, and AMPA compounds showed a good linear relationship in the range of 1-150 µg/L with correlation coefficients greater than 0.9995, recoveries in the range of 80.0% to 107%, and the relative standard deviations (RSD) were 2.9-5.0%, meeting the requirements of GB 23200.13-2016. The detection limits of the method met the more stringent requirements of SN/T 1923-2007 and were as follows for LOQs (µg/kg): glyphosate: 15.0; glufosinate: 27.0; AMPA:33.0. An inter-lab comparison fulfilled the requirements of GB/T 27404-2008. The developed method therefore offers the advantages of simple sample pretreatment, short time demand, high sensitivity, and recovery rate, and is suitable for the analysis of the 3 compounds in food.
Section Overview
Introduction
Glyphosate is a broad-spectrum herbicide with toxicity similar to organophosphorus compounds and is one of the most frequently used herbicides in the world. Furthermore, the chemicals’ usage increased after the introduction of genetically modified, glyphosate-tolerant crops such as corn, soybeans, and cotton. In the USA, the US Environmental Protection Agency (EPA) regulation document 40 CFR 180 sets the tolerance levels for the occurrence of glyphosate in food commodities and products. The EPA tolerance for glyphosate residues in dried tea is set at 1 ppm1. In rice, the tolerance is 0.1 ppm, whereas in sweet corn it is 3.5 ppm. For glufosinate, an herbicide that is often analyzed alongside glyphosate, the tolerance values are 1.1 ppm for canola meal and 1.0 ppm for rice. These tolerance values include metabolites and degradation products. The EU describes a Maximum Residue Limit (MRL) for tea of 2 mg/kg.2 (Aminomethyl)phosphonic acid (AMPA) is the main degradation product of glyphosate and is also included in most analyses targeting glyphosate determination.3-5
The detection methods reported so far include ion chromatography (IC), gas chromatography (GC), gas chromatography-mass spectrometry (GC-MS), high-performance liquid chromatography (HPLC), and high-performance liquid chromatography-tandem mass spectrometry (HPLC-MS/MS). Because glyphosate and its main metabolite AMPA are highly water-soluble and highly polar amphoteric compounds, the above-mentioned methods display some drawbacks. HPLC and particularly GC methods typically require derivatization, which is adding complexity and handling hazardous reagents. These also easily react with water and matrix components and form by-products, making quantitative analysis more challenging. Although GC-MS technology is qualitatively accurate and has little interference, excessive use of derivatization reagents may contaminate ion sources.6-7
The tea matrix is complex in composition and contains polar impurities such as polyphenols, amino acids, sugars, and pigments. Conventional sample preparation methods for glyphosate detection are mainly divided into solid-phase extraction purification and derivatization. Both method steps are tedious and add costs. In contrast, a cleanup by QuEChERS is simple and easy to apply. Traditional materials for QuEChERS might tend to over-retain certain pesticides. The Supel™ QuE Verde, a new and improved adsorption and purification mix, allows for a balanced matrix removal and analyte recovery, in particular for green samples.
The Supel™ QuE Verde clean-up tube contains Supelclean™ ENVI-Carb™ Y graphitized carbon, PSA (primary secondary amine), and Z-Sep+, a zirconia-coated silica adsorbent packing. This mix allows efficient removal of main matrix components such as organic acids, polyphenolic polar compounds, lipidic impurities, and (green) pigments while maintaining good recovery of planar pesticides.
Here we describe a method for the determination of glyphosate, AMPA, and glufosinate-ammonium in green tea with QuEChERS sample cleanup, using the Supel™ QuE Verde for efficient matrix removal and analyte recovery. The HPLC-MS/MS analysis is performed using a porous graphitic carbon (PGC)-based HPLC column, the Supel™ Carbon LC, allowing for simpler mobile phase conditions (reversed phase, RP) and omitting HILIC conditions.
The results are evaluated against the quality criteria described by two Chinese national standards. For linearity of calibration, reproducibility, and recovery, the criteria stated in GB 23200.13-2016, “National Standard for Food Safety—Determination of 448 pesticides and related chemical residues in tea by liquid chromatography-mass spectrometry”8, which is the most authoritative national standard for pesticide detection in tea in China at present, were applied. Regarding sensitivity (LOD & LOQ) the criteria described in SN/T 1923-2007, “Method for the determination of glyphosate residues in food for imported and exported food—the HPLC-MS/MS method”3 were used as a benchmark, as these limit values for glyphosate, glufosinate-ammonium, and AMPA are stricter than those stated in GB23220.13-2006, ensuring the developed method also meets this criteria.

Structural formulas of glyphosate (1), (aminomethyl)phosphonic acid (AMPA, 2) and glufosinate-ammonium (3).
Experimental
Standard, Sample, and Reagent Preparation
Sample Pretreatment
- About 500 g of a green tea sample was crushed/homogenized with a grinder, screened through a 20 mesh (0.85 mm) sieve, mixed thoroughly, and the resulting coarse powder was stored in a plastic container.
Reagent Preparation
- Extraction solvent: 400 mL of acetonitrile and 600 mL of water were combined to obtain a solution of acetonitrile/water 40:60 (v:v).
- Mobile phase A: 1.9217 g ammonium carbonate was weighed into a 1 L volumetric flask, and water was filled to the mark to prepare a 20 mmol/L ammonium carbonate solution.
Standard Preparation
- Glyphosate, glufosinate, and AMPA stock solution I (10 mg/mL): Weigh 0.20 g of each glyphosate, glufosinate, and AMPA standards into a 20 mL amber glass volumetric flask, dissolve with water, and fill up to the mark with water. The resulting stock solution with a concentration of 10.0 mg/mL of each glyphosate, glufosinate, and AMPA has to be stored at 0-8 °C and protected from light.
- Glyphosate, glufosinate, and AMPA stock solution II (100 mg/L): Pipette 0.1 mL of glyphosate, glufosinate, and AMPA stock solution I into a 10 mL amber glass volumetric flask and fill up to the mark with water to obtain stock solution II containing 100 mg/L of glyphosate, glufosinate, and AMPA. Store at 0-8°C and protected from light.
- Glyphosate, glufosinate, and AMPA stock solution III (1.00 mg/L): Pipette 0.1 mL of glyphosate, glufosinate, and AMPA stock solution II into a 10 mL amber glass volumetric flask and fill up to the mark with water to obtain stock solution III containing 1.00 mg/L of glyphosate, glufosinate, and AMPA. Store at 0-8°C and protected from light.
- Glyphosate, glufosinate, and AMPA standard solutions 1-6: Prepare a total of five standard solutions by pipetting 10 μL, 100 μL, 200 μL, 400 μL, 800 μL and 1500 μL, respectively, of glyphosate, glufosinate, and AMPA stock solution III into five individual 10 mL volumetric bottles. Fill up to the mark with acetonitrile/water 40:60 (v:v). Glyphosate, glufosinate, and AMPA concentrations of the resulting six standard solutions are 1.0 μg/L, 10.0 μg/L, 20.0 μg/L, 40.0 μg/L, 80.0 μg/L, and 150 μg/L, respectively.
Sample Preparation
- Extraction: Weigh 2 g ± 0.005 g of tea sample (accurate to 0.001 g) into a 50 mL centrifuge tube, add 20.0 mL of a mixture of acetonitrile/water (40:60, v:v), vortex at 3500 rpm for 2 min, perform ultrasonic extraction for 30 min, and centrifuge at 10000 rpm for 5 min to obtain a tea extract.
- Cleanup: Pipette 2.0 mL of the extract into a 15 mL Supel™ QuE Verde (55442-U) centrifuge tube, vortex for 3 min at 2500 rpm, centrifuge for 3 min at 10,000 rpm, and filter the supernatant using a 0.22 μm syringe filter.
- Spiking experiments: For the determination of recovery and precision, two samples were prepared by combining 2.0 g of a blank tea sample with 100 μL and 200 μL of glyphosate, glufosinate, and AMPA stock solution III, respectively. The glyphosate, glufosinate, and AMPA concentrations in the two resulting solutions are representing spiked samples of 50 µg/kg and 100 µg/kg, respectively.
The tea sample spiked with a glyphosate, glufosinate, and AMPA concentration of 100 µg/kg was applied to analyze precision, and the one with 50 µg/kg was utilized for the determination of recovery.
LC-MS/MS Analysis
The purified extracts were analyzed by HPLC-MS/MS (Table 1) using a Supel™ Carbon LC column with a volatile bicarbonate buffer in the mobile phase. This column possesses a unique mixed-mode retention mechanism that allows better retention of polar analytes without the need for HILIC conditions.
Note: Before first use, it is recommended to prime the Supel™ Carbon LC columns with sample matrix extracts (20-50 injections) to cover certain active sites on the surface for improved repeatability.
Results and Discussion
After extraction and QuEChERS cleanup, the tea sample was submitted to HPLC-MS/MS analysis (multiple reaction monitoring mode). The quantification was performed by an external calibration approach. A chromatogram for the analysis of glyphosate, glufosinate, and AMPA standard solution (10 µg/L) is displayed in Figure 1, showing good resolution. The separation for a spiked tea sample (50 µg/kg) is shown in Figure 5.
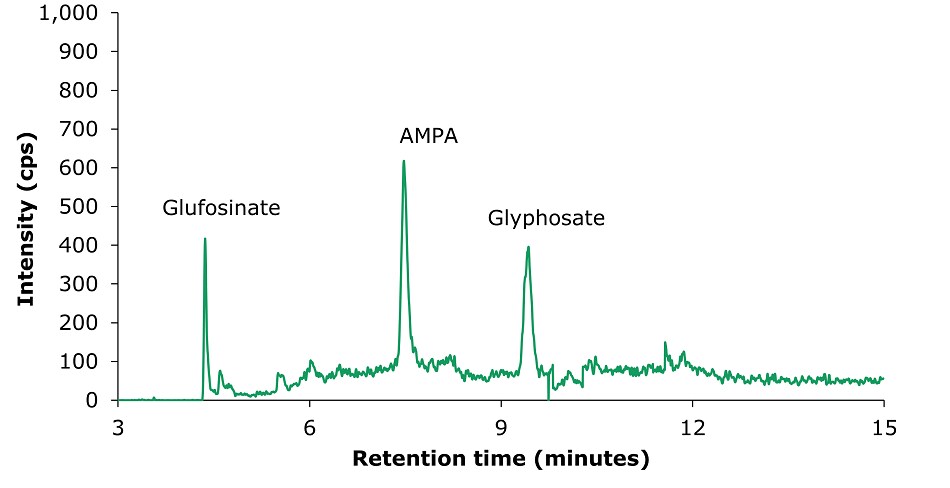
Figure 1.LC-MS/MS chromatogram obtained by the analysis of glyphosate, glufosinate, and AMPA standard solution 1 (10 μg/L). 1: Glufosinate (tr= 4.36 min), MRM transitions: 180.0 → 63.0 (quantitative); 2: AMPA (tr= 7.48 min), MRM transitions: 110.0 → 63.0 (quantitative); 3: Glyphosate (tr= 9.41 min), MRM transitions: 168.0 → 63.0 (quantitative).
Calibration & Sensitivity
The results of the external calibration experiments utilizing glyphosate, glufosinate, and AMPA standard solutions 1-6 (c=1.0, 10.0, 20.0, 40.0, 80.0, & 150 µg/L) showed good linearity for all compounds with R2 values between 0.9987 and 0.9995(GB 23200.13-2016 criteria R2>0.9950)8. The calibration data for glyphosate, glufosinate, and AMPA are shown in Figures 2-4 and Tables 3 & 4.
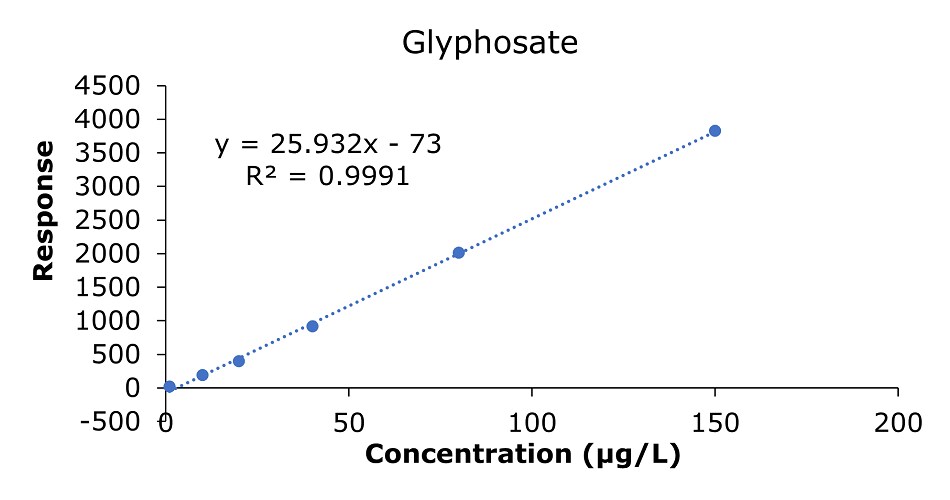
Figure 2.Calibration curve for glyphosate obtained by the analysis of standard solutions 1-6: (c = 1.0, 10.0, 20.0, 40.0, 80.0, and 150 μg/L).
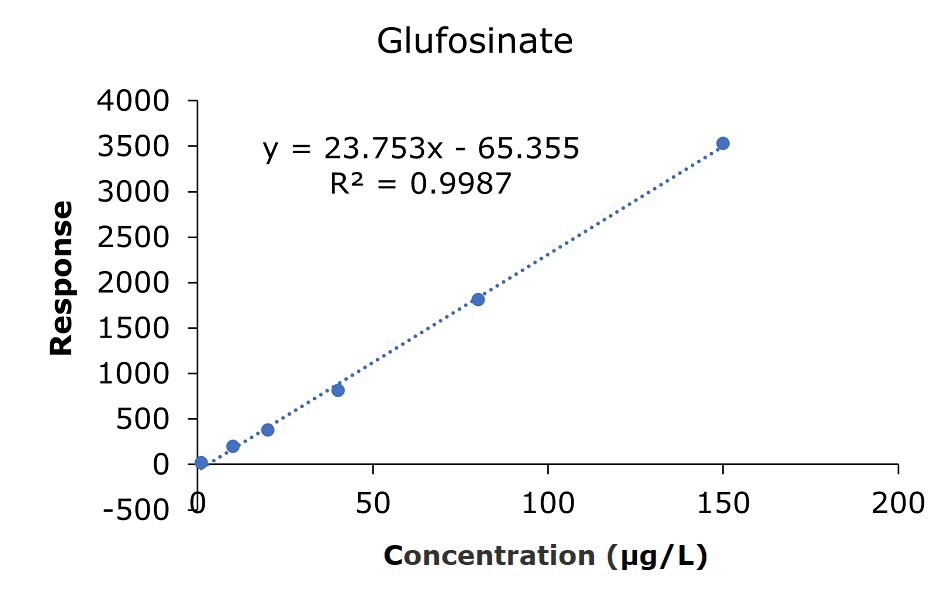
Figure 3.Calibration curve for glufosinate acid obtained by the analysis of standard solutions 1-6: (c = 1.0, 10.0, 20.0, 40.0, 80.0, and 150 μg/L).
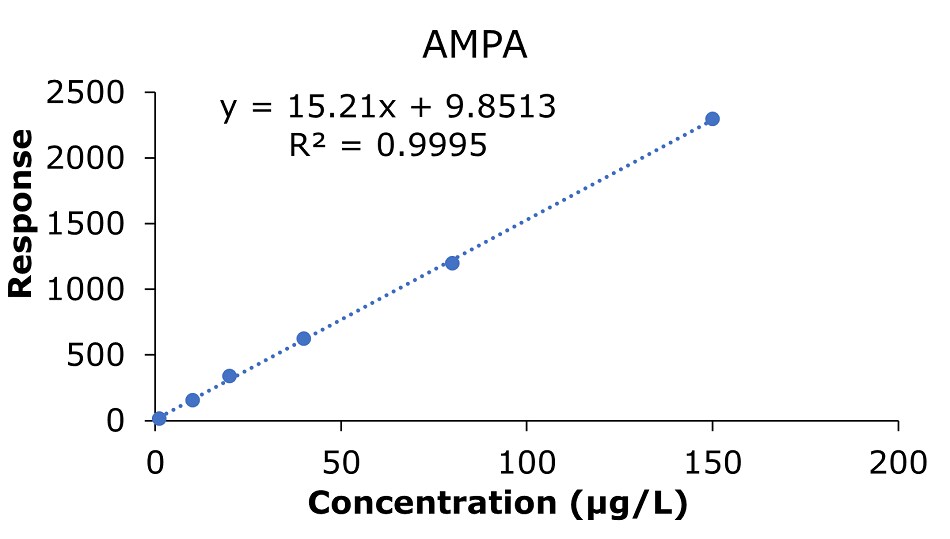
Figure 4.Calibration curve for AMPA obtained by the analysis of standard solutions 1-6: (c = 1.0, 10.0, 20.0, 40.0, 80.0, and 150 μg/L).
Precision & Recovery
Seven individual tea samples spiked with glyphosate, glufosinate, and AMPA at a concentration of 100 µg/kg (0.1 ppm) were applied to analyze precision (Table 5), and six individual tea samples spiked with 50 µg/kg (0.05 ppm) of each compound were utilized for the determination of recovery (Table 6). The precision/reproducibility was in the range of 2.9 to 5.0% RSD (n=7), meeting the GB 23200.13-2016 criteria of <15%; the average recoveries (n=6) ranged from 85.5 to 97.6%. (GB 23200.13-2016 criteria 60-120%).
Inter-lab comparison
As per the national standard GB/T 27404-2008 “Laboratory quality control specification—physical and chemical testing of food,9” the method was additionally tested in an external lab using a second Supel™ Carbon LC column. The results showed a deviation of 8.6%, well within the GB requirement for inter-lab comparison set at <15%.
Sample Measurements
LC-MS/MS chromatogram obtained by the analysis of a tea sample utilized for the determination of the method recovery rate (spiked at 50 µg/kg) is displayed in Figure 5.
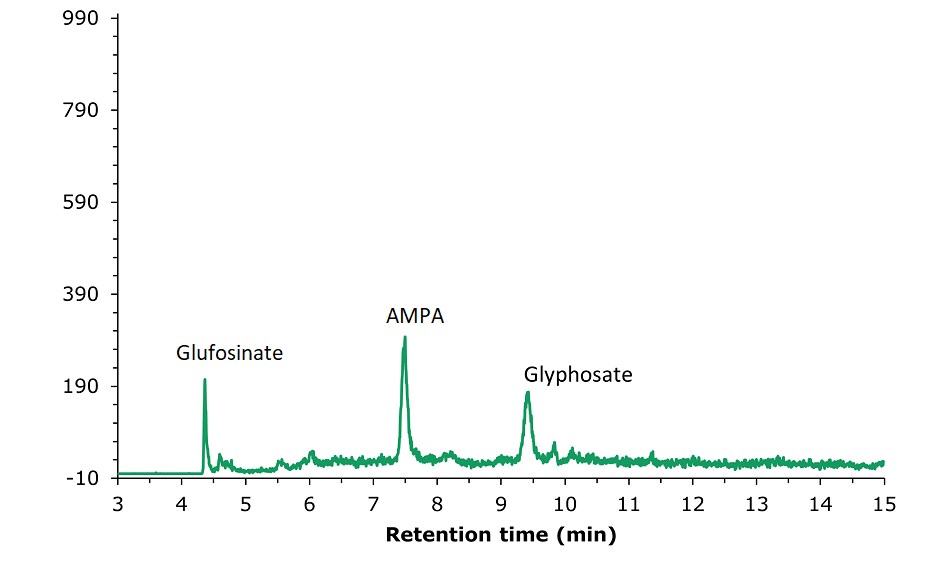
Figure 5.LC-MS/MS chromatogram obtained by the analysis of a tea sample spiked with glyphosate, glufosinate, and AMPA standard solution III at a concentration of 50.0 µg/kg. 1: Glufosinate (tr= 4.36 min), MRM transitions: 180.0 → 63.0 (quantitative); 2: AMPA (tr= 7.48 min), MRM transitions: 110.0 → 63.0 (quantitative); 3: Glyphosate (tr= 9.41 min), MRM transitions: 168.0 → 63.0 (quantitative).
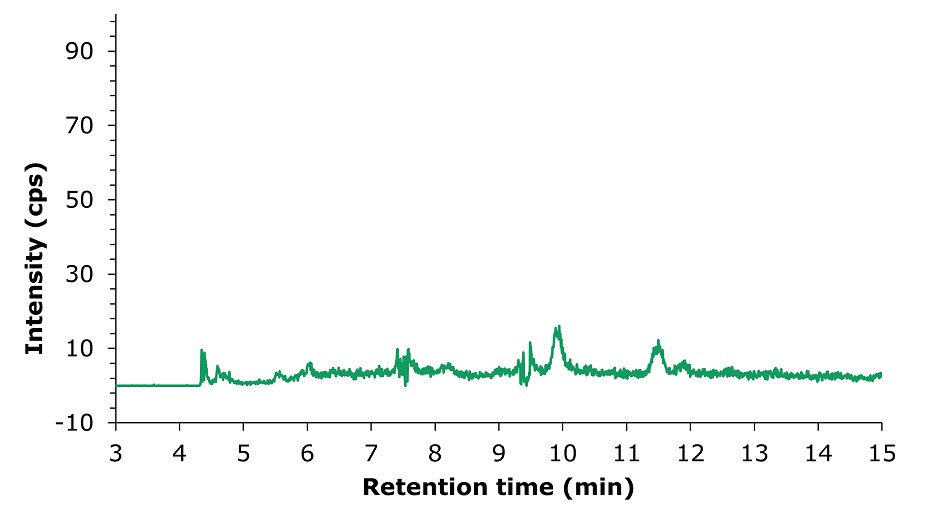
Figure 6.LC-MS/MS chromatogram obtained by the analysis of an unspiked tea sample.
Sensitivity of the Method
The sensitivity was determined using the baseline noise of a blank tea sample, where 3N/X was used to determine LOD and 10N/X was used to determine LOQ. Determined values and comparison data from the SN/T 1923-2007 method are shown in Table 8.
Conclusion
A U/HPLC-MS/MS method combined with solvent extraction and QuEChERS purification was established to determine glyphosate, glyfosinate, and AMPA residues in green/fresh tea. The samples were purified using a Supel™ QuE Verde adsorbent mix for green sample matrices and analysed by LC-MS using a Supel™ Carbon LC PGC UHPLC column that enabled RP conditions. Samples were quantified against an external standard calibration method. The results showed linear responses in the range of 1.0 to 150 μg/L for the injected solution with correlation coefficients (R2) greater than 0.998 for all three analytes. The observed recoveries were ranging from 81.0% to 107%, and the precision (RSD) was 2.7-5.0%. Therefore, linearity, RSD, and recovery rate were meeting the GB 23200.13-2016 method criteria. The determined sensitivities for LODs (µg/kg): glyphosate: 5.0; glufosinate: 9.0; AMPA:11.0; and for LOQ (µg/kg): glyphosate: 15.0; glufosinate: 27.0; AMPA:33.0. These meet or exceed the criteria of the SN/T 1923-2007 method. An inter-lab comparison showed reproducibility meeting the criteria of GB/T 27404-2008.
These results confirm the accuracy and reliability of the method for the detection and analysis of glyphosate, glufosinate, and AMPA in green tea.
Find more applications on Food & Beverage Testing.
REFERENCES
如要继续阅读,请登录或创建帐户。
暂无帐户?