Cell Harvest, Lysis, Neutralization and Clarification of Plasmid DNA (pDNA) for mRNA, plasmid-based DNA Vaccines, and Viral Vector applications
- Cell Harvest in pDna Manufacturing
- Cell Lysis Step in pDNA Manufacturing
- Neutralization Step in pDNA Manufacturing
- Pre-Clarification Methods in pDNA Production
- Clarification Step in pNDA Production
- Related Products
Plasmid DNA (pDNA) is typically produced by fermentation of a microbial source, usually Escherichia coli (E.coli). Following fermentation, downstream purification of pDNA begins with cell harvesting and lysis, followed by clarification.
Cell Harvest in pDNA Manufacturing
Fermentation methods for E.coli have been developed to increase cell density and improve productivity.
The goal of fermentation is to achieve dry cell weight of approximately 40-60 g/L and pDNA titers of 1 g/L. By optimizing vectors and the fermentation process, it is possible to reach pDNA titers of 2.2 g/L.
Bacterial cells containing the plasmid of interest are harvested when the culture reaches a specific optical density (OD) at 600 nm (OD600). This point of harvest is highly dependent on the media used for fermentation, Table 1.
During harvest, cells are concentrated, and the fermentation broth is removed via centrifugation or microfiltration-tangential flow filtration (MF-TFF). Centrifugation is a more cost-effective option when batch volumes are less than 10 L or greater than 1,000 L. Centrifugation options include continuous feed, intermittent solids-discharge, batch-discharge, solid bowl, or disc-stack. However, disk-stack centrifugation operating at high speed with intermittent rejection can reduce the yield of supercoiled plasmids by as much as 40% as a result of shear damage.1
Important considerations for pDNA harvest by microfiltration-tangential flow filtration (MF-TFF) and normal flow filtration (NFF) through clarification or bioburden reduction or sterilizing filters are outlined in Table 2.
TFF devices used in a harvest step include Prostak™ modules with microfiltration membranes such as Durapore® 0.1, 0.22 or 0.45 μm pore sizes, or Pellicon® 2 cassettes with V-screen (suspended screen) and open grade ultrafiltration (UF) membranes such as Biomax® or Ultracel® Ultrafiltration membrane with 1,000 kD cut-off. When using membranes such as these, it is important to utilize a two-pump (permeate-controlled) TFF system2. The MF-TFF harvest step typically involves a 2–5X volumetric concentration followed by a 3–5 volume diafiltration for washing out spent media components and extracellular impurities before downstream purification. TFF harvest is typically operated at low transmembrane pressure (TMP; 3–5 psi) and ∆P (<7 psi) with a control on the permeate flux (Table 3). Normalized water permeability (NWP) recovery post-use is >90%. The load challenge reported for Biomax® 1,000 kD membrane ranges from 10–60 L/m2 with an optimum permeate flux around 10–30 LMH.
Case Study 1: Cell Harvest by Tangential Flow Filtration (TFF)
Objective
Retain, concentrate, and wash the E. coli cells, which are approximately 2 x 0.5 μm
Materials and Methods
Device
- 0.1 m2 Pellicon® 2 cassette with 1000 kD Biomax® (polyethersulfone) membrane, V-screen for high viscosity & particles
Membrane preparation
- Water flush: 20 L/m2
- Clean-in-place recirculation: 0.2 N NaOH, 20 L/m2 single pass
- Buffer flush: 20 L/m2 10 mM Tris, 1 mM EDTA, pH 8 (TE)
Critical flux testing
- Adjust permeate flow rate (pump 2) and monitor TMP
Cell concentration
- Tank volume reduction with permeate to waste; cells are retained
Cell wash
- Constant volume diafiltration adds TE buffer at same rate as permeate removal
Cell Recovery
- Drain tank and flush retentate line and flush tank
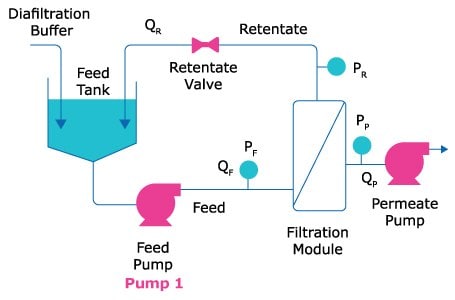
Figure 1.Cell concentration, wash, and recovery steps in plasmid DNA harvest.
Results
Testing was performed to identify the optimal flow rate for operation. Permeate flux was ramped up until instability in the transmembrane pressure (TMP) was observed (Figure 2A). While TMP was stable at flux up to 10 LMH, at 20 LMH flux range, TMP was unstable indicating that the process should be operated below this value. TMP of about 15 LMH was used for the operational flux.
Over the course of cell concentration, viscosity of the solution increased, increasing the TMP, causing instability. To accommodate this, flux was reduced to 11 or 12 LMH and while a slight increase in TMP was observed, it was more manageable from an operational perspective. Using this approach, a 2.1-fold concentration factor of cells was achieved (Figure 2B).
The cell wash step was performed at an average flux of 12 LMH (Figure 2C) over the course of two diavolumes to exchange into Tris-EDTA (TE) buffer to remove impurities including media components, HCPs (host cell proteins), and nucleic acids. The process was stable as shown by the TMP, which remained low (~5 psi) during the wash step.

Figure 2.Identification of optimal flow rate for cell harvest by TFF. (A) Permeate flux was ramped up until 20 LMH where instability of pressure occurred. 15 LMH was chosen as the operational flux. (B) Increasing cell concentration increases viscosity and transmembrane pressure (TMP). Reducing the flux to 11 or 12 LMH to maintain acceptable TMP and achieve a 2.1-fold concentration of cells. (C) Cell wash steps over two diavolumes at average flux of 12 LMH.
Cell Lysis Step in pDNA Manufacturing
Once harvested, E. coli cells are disrupted to release the plasmid DNA. Cell disruption occurs through either chemical lysis (alkali, detergents, enzymes, osmotic shock) or physio-mechanical methods (heat, shear agitation, sonification, freeze-thaw). For any pDNA manufacturing steps using downstream process chemicals, it is important to understand the appropriate quality attributes and documentation packages required to mitigate risk and streamline regulatory filing.
Cell lysis is commonly performed with 0.1–0.5 N NaOH pH~12 and 0.1–0.2% SDS. The detergent solubilizes the cell walls, and the alkaline environment denatures genomic DNA while the pDNA remains intact. The optimum pH value is dependent on the type of plasmid and bacterial host strain. Tight control of pH during alkaline lysis is critical to maintaining high pDNA yield: At pH >12.5, pDNA becomes irreversibly denatured and if the pH is too low, genomic DNA won’t be completely denatured complicating downstream purification. Irrespective of the method used to lyse bacterial cells, the lysis incubation time should be optimized as it impacts both the quality and yield of pDNA: longer incubation times can result in irreversible denaturation of pDNA and shear degradation of genomic DNA.
Adequate mixing during alkaline lysis maintains the target pH and minimizes negative effects on the pDNA quality. At lab scale, mixing is often performed manually but large-volume mixing often uses specialized, mechanically agitated vessels designed to accommodate the viscous flow properties of the lysate. Mobius® single-use mixers are an alternative single-use solution for effective mixing of large-volume lysates.
Newly developed autolytic E. coli strains offer a new approach for cell lysis. Under slightly acidic, low-salt buffer conditions at low concentrations of nonionic detergent, these bacteria autolyse enabling pDNA recovery. Genomic DNA impurities remain associated with the insoluble cell debris and are removed by solid-liquid separation using thermal flocculation and coarse filtration.
It is critical to have efficient but not too aggressive mixing employed on the alkaline lysis step to ensure there are no pH extremes causing irreversible denaturing of the plasmids or degrading it due to excessive shear. In a laboratory setting, mixing is often performed gently by hand, which is not feasible at larger scales. For achieving complete but gentle mixing of large lysis volumes, batch mixing in a mechanically agitated vessel (specialized vessel design with utilizing baffles, low power number impellers, feed lines) and/or continuous flow-through devices/in-line static mixers have been used, taking into consideration viscous non-Newtonian properties of the lysate. Mobius® single-use mixers can be very effective for batch lysis.
A completely different method for cell lysis involves the use of newly developed autolytic E. coli strains. The pDNA is recovered by autolytic extraction under slightly acidic, low-salt buffer conditions and treatment with a low concentration of nonionic detergent. Genomic DNA remains associated with the insoluble cell debris and is removed by solid-liquid separation using a thermal flocculation followed by coarse filtration.
Neutralization Step in pDNA Manufacturing
Precipitation/flocculation is the first step in removing host cell contaminants in pDNA manufacturing. The lysate is first neutralized with sodium or potassium acetate (0.7 M-3.0 M) often in the presence of surfactant (ex: 1% SDS), RNase, or 0.8-1.5% CaCl2. This step precipitates detergent solubilized proteins and high molecular weight genomic DNA. Some chaotropic salts, such as lithium chloride, ammonium acetate, and calcium chloride will also precipitate high molecular weight RNA with the proteins and, if present, RNase will degrade the high concentrations of RNA impurities. Alternatively, a low-cut off polyethylene glycol (PEG) at 4% w/v can be used to precipitate genomic DNA impurities. Ideally the precipitation/flocculation step results in precipitation of impurities and renaturation of the smaller, covalently closed circular pDNA into soluble, double-stranded molecules.
Pre-clarification Methods in pDNA Production
Chemical lysis and neutralization result in the formation of large floccules/precipitates which float on top of the treated lysate. Clarification steps should separate insoluble impurities from the soluble pDNA. pDNA streams can be untreated, pretreated or pre-clarified.
Pretreatment has a major impact on the clarification filter capacity and options include gravity settling, PEG precipitation, and bag filters. Any pretreatment method must be considered in the context of process scalability. Product loss has been observed occasionally with filtration, and filters with low adsorption are preferred.
Review of our internal database shows lysates were pretreated approximately 75% of the time (Figure 3) before clarification:
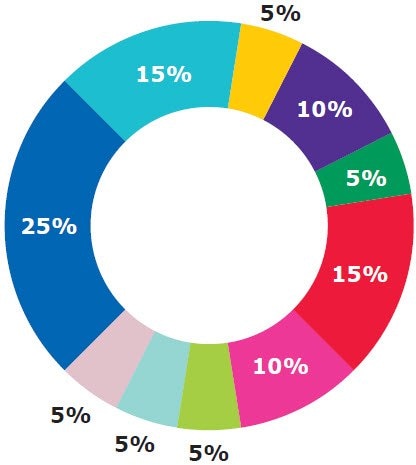
No pre-clarification: 25%
PEG precipitation: 15%
Natural floating separation: 15%
Centrifugation: 10%
SS filter: 10%
PEI flocculation: 5%
PEI + centrifugation: 5%
Bag separation: 5%
Paper filtration: 5%
Empty chromatography column: 5%
Figure 3. Various reported pretreatment/prefiltration conditions.
Case Study 2: Cell Alkaline Lysis, Neutralization, and Pre-clarification
Objective
Identify optimal conditions for E. coli lysis to release pDNA product and neutralize the resulting solution.
Materials and Methods
- 125 g wet weight/L of cells were resuspended in TE buffer (10 mM Tris, 1 mM EDTA, pH 8)
- Experimental lysis buffers containing 1% SDS and variable NaOH concentrations (ranging from 0.05 M to 0.15 M NaOH) were added to different pools of resuspended cells in a 1:1 volume ratio. Lysis was evaluated over variable timepoints ranging from 1 - 60 minutes.
- Neutralization buffer (3 M Potassium Acetate, pH 5.5) was added in a 1:1 volume ratio to quench the reaction.
- The mixture was centrifuged at 12 kg for 30 minutes and filtered (0.45 µm)
- PAGE or fluorescent dye was used to evaluate assay nucleic acid content in the final solution
Results
Lysis results for different buffer conditions and time points are shown in Figure 4A for a constant 5-minute lysis time and variable sodium hydroxide concentrations. The smear at the bottom of the gel indicates RNA impurity, while the bands toward the top of the gel represent pDNA product. As the sodium hydroxide concentration was reduced, there was a decreased intensity of the plasmid DNA in solution, indicating a higher concentration of sodium hydroxide was preferred for lysis.
The bottom gel (Figure 4B) represents 0.1 M NaOH and variable time points. Lane 1 is a negative control with no incubation time, lane 2 is a 10-minute incubation time, and lane 3 is 60 minutes. At the 60-minute time point, there is plasmid DNA and a very intense smear at the bottom of the gel, possibly indicating degradation of plasmid DNA product. In contrast, the 10-minute time point looks ideal.
Orthogonal assays were run using the QuantiT double-stranded DNA assay to determine the concentration of DNA for the different samples (Figure 4C). The 5-minute time point and highest concentration of NaOH give the highest concentration of double-stranded DNA, which confirms the data shown in the gels. As a result, operating setpoints for the lysis step were determined to be between 5 and 10 minutes, with 0.1 M to 0.15 M sodium hydroxide, and 1% SDS.
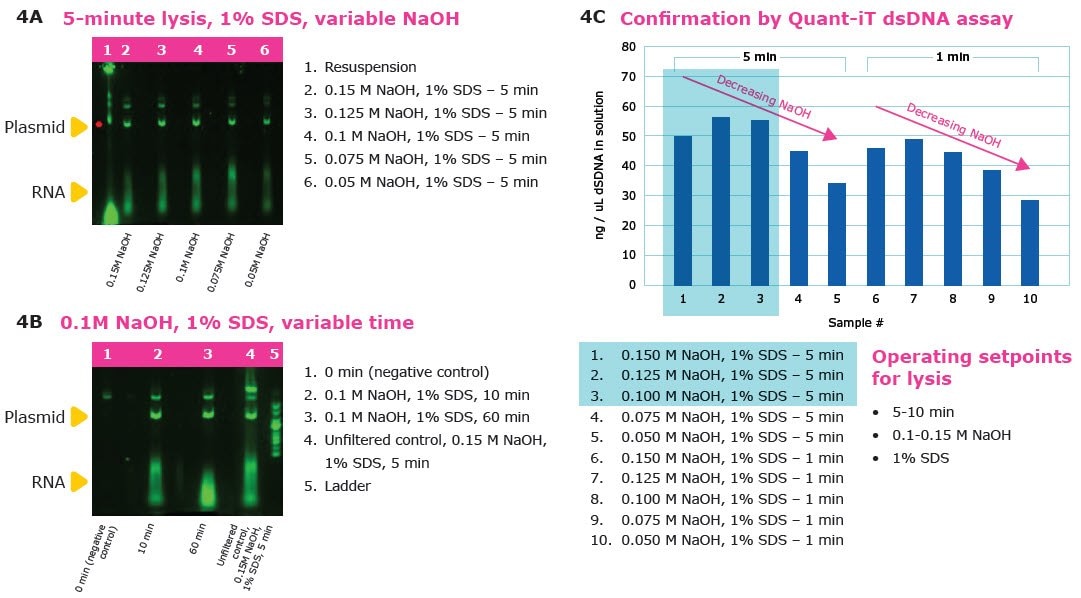
Figure 4.Alkaline lysis optimization for pDNA manufacturing. (A) Alkaline lysis for 5 minutes using 1% SDS and variable NaOH concentrations shows a higher concentration of NaOH more effectively removes RNA. (B) Alkaline lysis with 0.1M NaOH, 1% SDS, and variable NaOH concentrations shows a 10-minute incubation time is ideal. (C) A Quant-iT dsDNA assay finds the operating setpoints for lysis should be between 5–10 minutes using 0.1–0.15 M NaOH and 1% SDS.
Clarification Step in pDNA Production
For efficient separation, clarification filters should have sufficient holding capacity for the solid load of the lysate. Depth filters offer high capacity and yield as adsorptive interactions are masked by the high salt concentration of lysate feed. Optimization of depth filtration (flux, filtration endpoint) during process development should be considered to ensure high pDNA yield with minimal filter area. Incorporating product recovery steps such as blow down and buffer flushing into clarification operations can result in yields of greater than 90%.
Feed quality impacts the NFF operations including processing lysate through clarification filters. Our internal database shows two kinds of feed, either pretreated (feed turbidity 20 to <500 NTU) or untreated feed (feed turbidity >1,000 NTU). The most common pretreatment reported was gravity separation of floccules and solution: solutions were carefully filtered without disturbing floccules/sediments and a product loss of approximately 20% was reported. Another pretreatment method included use of stainless steel filter, bag filter, empty column, paper filter, centrifuge, polyethyleneimine (PEI) flocculation and centrifugation, and use of Polygard® CR 100 µm/Polygard® CR 50 µm filters.
Filters commonly used for NFF of pretreated or untreated feed are listed in Table 4. Average capacity of the filters is shown in Figure 5. Lysate can be clarified using depth filtration, such as Clarisolve®, Millistak+® HC, and Millistak+® HC Pro filters, to achieve high filtration capacity and yield. These filters are available in a wide range of formats with sizes from 0.014 m2 to 1.1 m2.
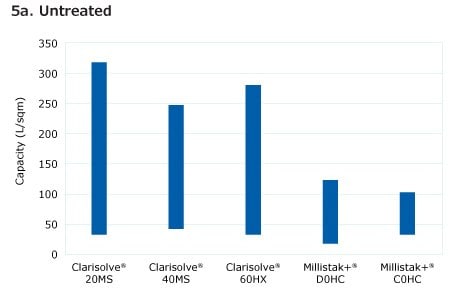
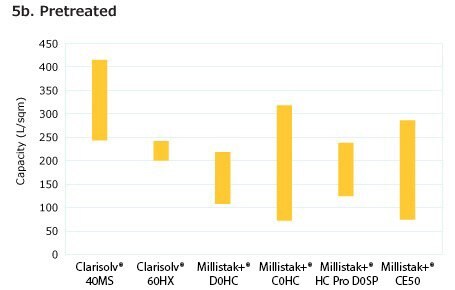
Figure 5. Average capacity range of Clarisolve® filters, Millistak+® HC, and Millistak+® HC Pro filters for pretreated and untreated feed.
Depending on the turbidity of the clarified lysate, secondary clarification and further NFF steps may be needed before further downstream purification. Following filtration through Clarisolve® or Millistak+® HC depth filters, other NFF bioburden reduction or sterilizing filtration options include Milligard® PES 1.2/0.45 μm filters or Millipore Express® SHC filters. Each of these filters will reduce the levels of particulates and bioburden, further clarifying the lysate and reducing contamination risk for the downstream process.
Case Study 3: Clarification
Objective
Lysate clarification using a series of depth and sterile filtration.
Materials and Methods
Following alkaline lysis and subsequent neutralization with 3M potassium acetate, impurity species (genomic DNA and some host cell proteins) flocculate and float to the top of the solution. Plasmid DNA product re-anneals upon neutralization and remains in the bottom layer. The bottom product layer is clarified by depth filtration, followed by sterile filtration. Several options were evaluated for - clarifying filtration:
Single-stage and dual-stage depth filtration options:
- Clarisolve® 60HX – open pore size filter made of low binding polypropylene
- Millistak+® C0HC – Tighter pore size filter containing positively charged filter media, composed of cellulose fiber and diatomaceous earth (DE). The positively charged filter can impact the yield of negatively charged pDNA.
Sterile filtration:
- Millipore Express® SHC – Cast PES membrane, sterilizing grade, single-use
Filter Train 1 consisted of Clarisolve® 60HX, followed by Millipore Express® SHC.
Filter Train 2 utilized both Clarisolve® 60HX and Millistak+® C0HC depth filters, followed by Millipore Express® SHC.
Results
Depth filter sizing data showed that Filter Train 1 resulted in very low pressure drop over the course of this experiment; turbidity breakthrough was observed, however, between 200 and 300 liters per meter squared of loading. For the tighter Filter Train 2, higher pressure was observed, as would be expected from a tighter depth filter, but there was no turbidity breakthrough (Figure 6). The lower turbidity material from Filter Train 2 resulted in a higher sterile filter throughput compared to Filter Train 1, as seen by the flux decay data (Figure 7). Filter Train 1 resulted in a much higher yield at 98% versus Filter Train 2 which had an 82% product yield. This was due to the DE in the Millistak+® C0HC filter which has some charge that contributes to product yield loss. Based on these results, the process implemented Filter Train 1 to maximize yield for this step.
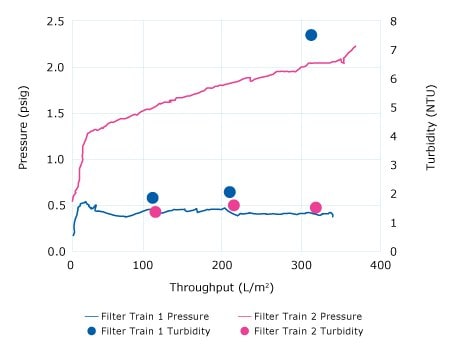
Figure 6.Depth filter sizing. Constant flow test (Pmax™, Tmax). Monitor pressure rise and turbidity.
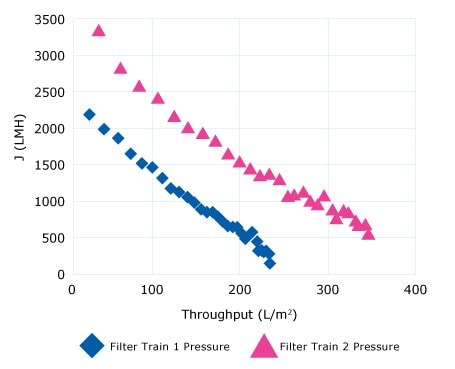
Figure 7.Sterile filter sizing. Constant pressure test (Vmax™). Watch flux decay.
Related Products
- Prostak™ MF modules
- Biomax® (PES)
- Ultracel® membranes
- Clarisolve® filters
- Milligard® filters
- Millipore Express® SHC filters
- Millistak+® HC filters
- Millistak+® HC Pro filters
- Polygard® CR filters
- Durapore® Membrane Filter 0.22 µm
- Durapore® Membrane Filter 0.45 µm
- Pellicon® 2 Cassettes with Biomax® 1000 kDa Membranes
References
To help maintain compliance with current Good Manufacturing Practices, we have developed the Emprove® Program, learn more here
To continue reading please sign in or create an account.
Don't Have An Account?