Measuring Kinase Inhibitor Residence Times
This Application Note provides a protocol and experimental example for the use of the Transcreener® ADP2 FP Assay to determine the residence time of a drug (or drug candidate) during its interaction with a kinase.
The duration of residence time may be highly relevant for assessing the durable pharmacologic effects of a drug candidate. In general, longer residence time results in improved efficacy, as the extended contact between drug and enzyme results in extended inhibition of enzyme activity. This in turn allows longer pharmacological effects at lower doses, reducing off-target effects.
Residence time (τ) is the time that a drug remains bound to its target before dissociating. Residence time is the reciprocal of dissociation rate (koff).
The dissociation rate constant koff can be determined using a “jump dilution” method in which enzyme activity is monitored over time as an inhibitor dissociates. The jump dilution method is performed in four steps:
- Incubate the kinase with a saturating concentration of inhibitor (e.g., 10 × IC50).
- Dilute the kinase/inhibitor mixture into a solution containing all enzyme reaction components and Transcreener® ADP2 detection reagents.
- Measure fluorescent signal periodically to monitor the recovery of kinase activity over time.
- Determine koff by fitting enzyme progress curves to an integrated rate equation:

Materials
- Black, Non-Binding, LV volume 384 well plate
- Plate reader (e.g., Tecan Safire)
- Transcreener® ADP2 FP Assay
- Expressed, purified kinase(s) of interest
- Inhibitor(s) of interest
- Kinase buffer (e.g., 50 mM Tris (pH 7.5), 5 mM MgCl2 and 0.01% Brij® 35)
Protocol
I. Determine Optimal Enzyme Concentration and IC50 Value.
Prior to determining koff, it is important to identify the optimal enzyme concentration and the IC50 values of the inhibitors for which off rates are to be measured. Detailed methods to determine the optimal enzyme concentration and IC50 values are beyond the scope of this application note; however, an example is given below.
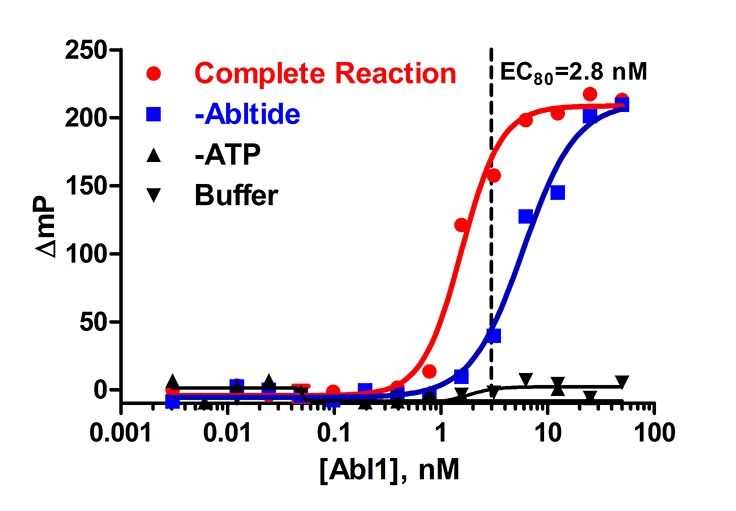
Figure 1. Abl1 enzyme titration in the presence of 5 μM ATP and 10 μM Abltide. A concentration (EC80) of 2.8 nM was determined to be optimal from this titration. The reaction was run in a kinase buffer (50 mM Tris (pH 7.5), 5 mM MgCl2, 0.01% Brij).
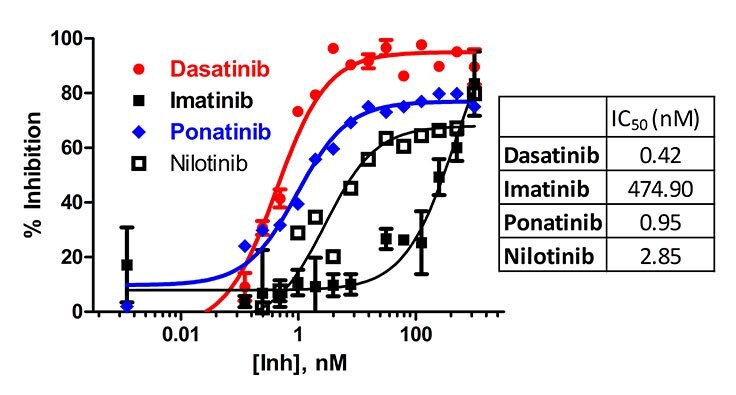
Figure 2. A dose response curve for Abl1 enzyme (2.8 nM) in the presence of 5 μM ATP and 10 μM Abltide. IC50 values of 0.42 nM (Dasatinib), 475 nM (Imatinib), 0.95 nM (Ponatinib) and 2.8 nM (Nilotinib) were determined based on this experiment. The reaction was run in a typical kinase buffer (50 mM Tris (pH 7.5), 5 mM MgCl2, 0.01% Brij).
II. Jump dilution method
II-a. Preincubation Protocol
I. Select an amount of kinase for the pre-incubation step such that, after dilution in the binding assay, the resulting concentrations of kinase and antibody will still provide a robust signal. We recommend using a kinase concentration equivalent to the EC80 value × 100.
II. In general, the inhibitor concentration chosen should be 5 to 20 times the IC50.
III. For the example described above with Abl1, we choose 280 nM enzyme, 45 nM Dasatinib, 100 nM Ponatinib, 45 µM Imatinib and 25 µM Nilotinib. DMSO alone controls (no inhibitor) were also run simultaneously. A control lacking enzyme is also critical to allow calculation of maximum inhibition.
IV. To permit the [EI] complex to form, incubate 10 µL of Abl1 enzyme with 10 µL of inhibitor/DMSO in 50 mM Tris (pH 7.5), 5 mM MgCl2 and 0.01% Brij for 1 hour at room temperature.
II-b. Dilution and Measurement
I. Ideally, the dilution step should bring the concentration of inhibitor below its IC50 value. A typical dilution is 0.2 μL of Abl/Inhibitor mixture into 19.8 μL of Detection Mixture in a LV-384 well plate (Corning 4514, black). A 100-fold dilution was used in this example. Higher dilutions will yield better results.
(1) Note: this method is called “jump dilution” because the [EI] complex is diluted in a detection mixture that contains saturating amounts of substrate.
II. For Abl1, we used 5 µM ATP and 10 µM Abltide in kinase buffer containing 2 nM tracer and 3.2 μg/mL of ADP2 antibody.
III. The plate was mixed well and read kinetically every 5 minutes for 4 hours in a Tecan Safire plate reader using the fluorescent polarization mode with EXC at 630 nm and EMS at 670 nm.
IV. A standard curve under similar conditions was also run kinetically at 5 µM ATP/ADP at various percent conversions in the presence of 10 µM Abltide to enable converting the raw polarization data into product formed (µM ADP).
II-c. Controls Required for Data Analysis
I. To calculate initial velocity (V0), run an uninhibited Abl1 reaction by running 2.8 nM enzyme in the presence of 5 µM ATP and 10 µM Abltide.
II. To calculate steady-state velocity (VS), run a fully inhibited Abl1 reaction by running enzyme in the presence of 100 × IC50 of any potent inhibitor. In this example we used 2.8 nM Abl1, 400 nM Dasatinib in the presence of 5 µM ATP and 10 µM Abltide.
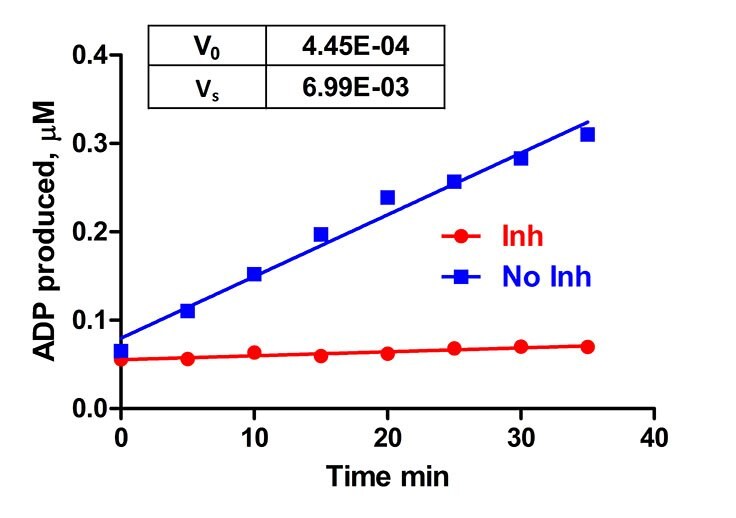
Figure 3. Enzyme velocity V0 was determined for fully inhibited reactions using Abl1 enzyme, 2.8 nM in the presence of 400 nM Dasatinib, 5 μM ATP and 10 μM Abltide. Enzyme velocity VS was determined for un-inhibited reactions using Abl1 enzyme, 2.8 nM in the presence of 5 μM ATP and 10 μM Abltide.
III-c. Data analysis
I. Data conversion
Data analysis was performed using the GraphPad Prism software package.
A. Convert the polarization data into product formed (µM ADP) using a standard curve (described in the ADP2 FP Assay Technical Manual).
B. Only use data that shows less than 30% consumption of ATP to ensure initial velocity conditions.
II. Determining koff and residence time by fitting curve to equation in GraphPad Prism
A. Substitute the values of V0 and VS from Figure 3 into this equation:
B. Obtain this equation: Y=0.006985t-0.00654/K(1-exp-K*X)
C. Open the analysis window in GraphPad Prism and select New Equation.
D. Enter the new equation.
E. Set “rules”- Define K as 1/Value of X at Ymax.
F. Fit the curve in Graph Pad using this equation to determine the koff values.
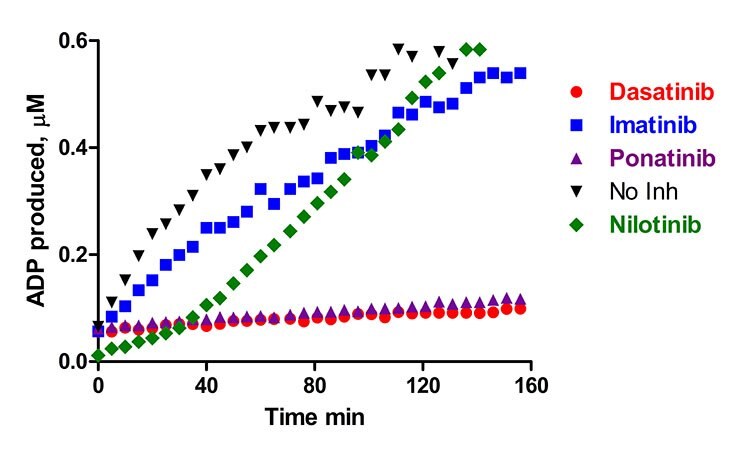
Figure 4. Linear relationship between reaction progress times and ADP formation. The polarization values were converted into ADP (product formed) using a standard curve set up under similar conditions.
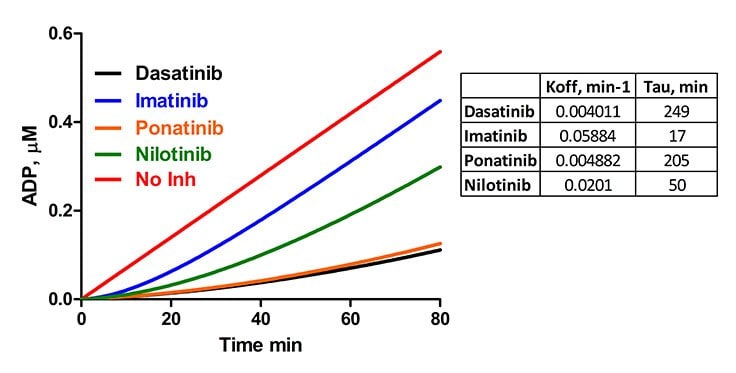
Figure 5. Residence times for Dasatinib, Imatinib, Ponatinib and Nilotinib were determined for Abl1 in a jump dilution experiment using the Transcreener® ADP2 FP Assay. For Abl, compound incubations were performed with an Abl concentration of 280 nM and inhibitor concentrations of 45 nM (Dasatinib), 45 μM (Imatinib), 25 μM (Nilotinib) or 100 nM (Ponatinib). A 100-fold jump dilution was performed by adding 19.8 μL of 10 μM Abltide and 5 μM ATP in presence of detection reagents. Tau values were calculated by taking the reciprocal of koff
Summary
We have described a jump dilution protocol for determining the dissociation rate constant koff using the Transcreener® ADP2 FP Assay. As an experimental example, residence times for Dasatinib, Ponatinib, Nilotinib and Imatinib for the target Abl1 are calculated.
Transcreener® is a registered trademark of BellBrook Labs. The Transcreener® product line is the subject of U.S. Patent No. 7,332,278, 7,355,010 and 7,378,505 issued. U.S. Patent Application Nos. 11/353,500, 11/958,515 and 11/958,965, U.S. Divisional Application 12/029,932, and foreign equivalents licensed to BellBrook Labs.
Related Products
如要继续阅读,请登录或创建帐户。
暂无帐户?