Quantitative Analysis of Urea in Milk by Thin-Layer Chromatography (TLC) using TLC Explorer
Ajay Kaparwan
R&D and Customer Support Labs APAC (Jigani, Bangalore, India)
Abstract
Milk adulteration presents a significant health hazard to humans. One of the most frequently encountered adulterants in milk is urea, as it mimics a higher protein content. However, such adulteration presents a significant health hazard to humans. Here, a simple and efficient approach by HPTLC is demonstrated, providing a rapid and accurate detection of urea in milk using a new documentation system, the TLC-Explorer.
Section Overview
Introduction
Milk is one of the most crucial general food and nutrition products, as it is rich in calcium and other essential nutrients, including proteins, fats, minerals, carbohydrates, and various vitamins needed by both infants and adults.1,2 Being an affordable source of high-protein nutrition, government nutrition support programs in many countries provide milk and dairy products free of charge to students in schools, addressing nutritional deficiencies and thereby benefiting future generations.3 This has led to increased demand for milk over the years. To maximize profits and exploit the gap between demand and supply, some vendors engage in unethical practices, such as adulterating milk to artificially increase the value of their provided product.4 Adulteration with nitrogen-rich compounds such as urea has become an easy and cheap practice of such vendors to imitate a higher protein content and increase solid-not-fat (SNF) content.5 However, these adulterants pose significant health risks for consumers as they can adversely affect various organs in the human body, including the heart, liver, kidneys, and intestines, and may even result in death.6,7
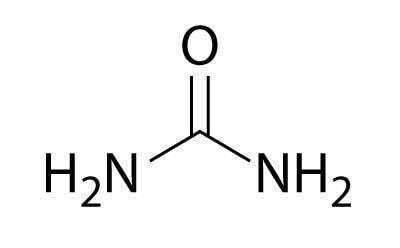
Urea
Urea, also known as carbamide, is an organic compound that plays a crucial role in the metabolism of nitrogen-containing compounds in animals and is the primary nitrogenous substance found in the urine of mammals. The urea content in cow's milk typically ranges from 20 mg to 70 mg per 100 mL, and levels exceeding this range are considered adulterated or intentionally added.8
In this work a simple and efficient analytical method for determination of urea in milk using thin-layer chromatography (TLC) is demonstrated for two commercial milk samples. The samples are diluted, centrifuged, and then directly applied onto a silica gel 60 F254 high-performance thin-layer chromatography (TLC) plate. The identification, quantification, and imaging of urea present in the samples is performed with a TLC visualizer and documentation system, the TLC Explorer (Figure 1). This system is an easy-to-use hardware and software concept for TLC plate imaging, analysis, and data handling. It is applicable for routine measurements, such as in-process control, method development, or daily research activities.
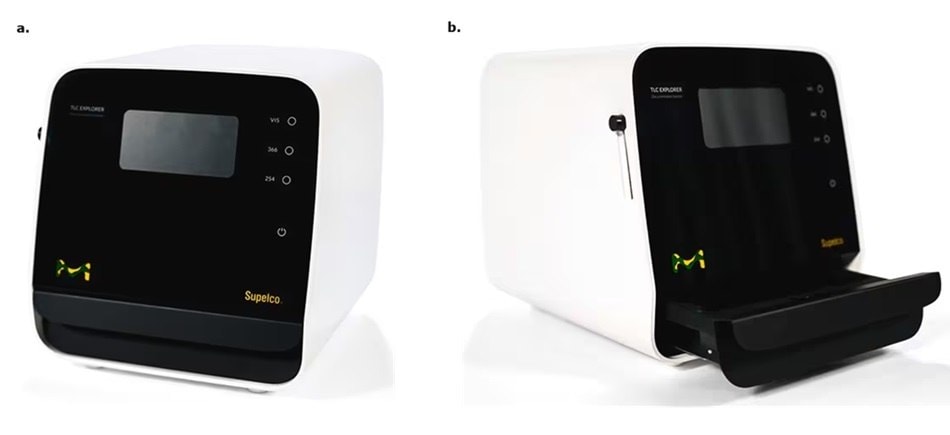
Figure 1.TLC Explorer (a. closed; b. plate tray open).
The TLC Explorer system contains a camera and three different LED light sources to view, analyze and document TLC plates at wavelengths of 245 nm, 366 nm, and VIS (white light). It is a “no service maintenance required” instrument, that has a check window for a quick and safe visual examination of chromatograms/plates and the safety feature of no exposure of UV light outside the device during measurements. The instrument is equipped with a Wi-Fi antenna making it easy to connect with any desktop device.
The performance of the here developed method on the TLC Explorer is also partially assessed regarding response as per the ICH Q2 R2 guidelines.9
Experimental
Reagent preparation
Ehrlich reagent: Dissolve 5 g of 4-(dimethylamino)benzaldehyde in 40 mL ethanol and slowly add 10 mL HCl (37%) with cooling. The temperature should not fall below 20 °C or rise above 40 ºC.
Standard Preparation
- Diluent: Methyl alcohol and water (4:1 v/v)
- Urea standard solution (0.7 mg/mL): Weigh and transfer 7 mg of urea certified reference material to a 10 mL volumetric flask, add 5 mL of diluent and sonicate for 5 min with intermittent shaking, then make up to volume with diluent, and mix thoroughly. Use different application volumes for calibration curve creation.
Sample Preparation
Two milk samples (1 & 2) were sourced from a local supermarket.
- Milk sample solution: Dissolve 5 mL of milk in 5 mL of water. Mix thoroughly and centrifuge at 2500 rpm for 10 min. Use the clear supernatant and spot on the chromatographic plate (5 µL).
- Recovery sample solution: Weigh and transfer 7 mg of urea certified reference material to a 10 mL volumetric flask, add 5 mL of milk sample 1, sonicate for 5 min with intermittent shaking, then make up to volume with diluent, mix thoroughly, and centrifuge at 2500 rpm for 10 minutes. The clear supernatant was used at different application volumes.
Note: The milk samples used for spiking did not show a detectable background of urea.
TLC Method
The separation was performed on silica gel 60 F254 on aluminum support (Table 1). After drying, the plate was sprayed with Ehrlich reagent and then viewed under white light.
Results and Discussion
Calibration standards and milk samples were analyzed by evaluation of the developed intense yellow urea bands after derivatization and video densitometry under white light (Figure 2). An example video densitogram, created by the TLC-Explorer system, for the calibration track with 4.9 µg urea per spot is shown in Figure 3.
The experimental results, such as retention factors (Rf) and peak areas determined for the applied spots, are shown in Table 3.
The calibration ranged from 1.4 µg per spot to 4.9 µg per spot (6 calibrants, tracks 1-6), representing, for a 5 µL application of diluted milk sample, concentrations in the original milk of 560 to 1960 µg/mL (56 to 196 mg/100 mL). The polynomial calibration curve fit provided an R2 value of 0.9964 (Figure 4).
Using three different volumes of the spiked recovery sample showed recoveries in the range of 87.1 to 103.9% (Table 3).
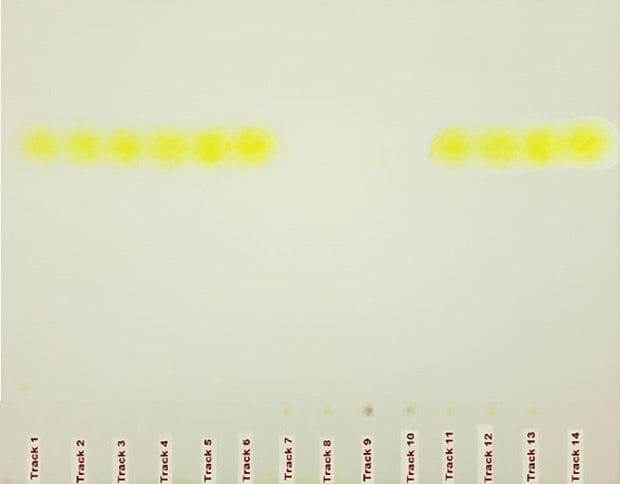
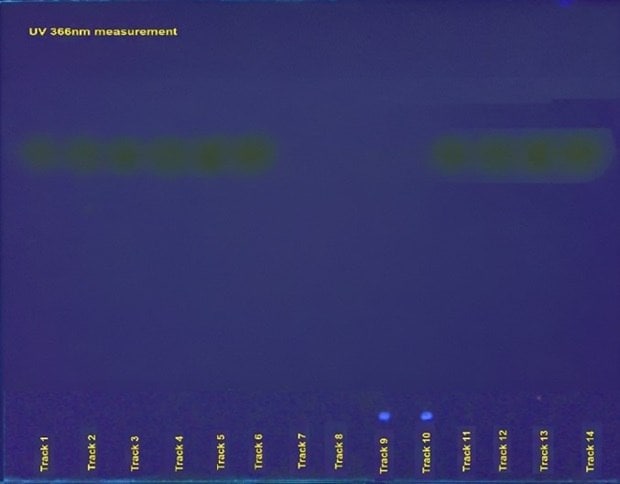
Figure 2. HPTLC chromatograms for identification of urea in milk samples (left: visible light; right: UV 366 nm). Tracks 1 to 6 were utilized for the determination of linearity in the concentration range of urea ranging from 1.4 µg per spot to 4.9 µg per spot, tracks 7 and 8 represent commercial milk sample 1, and tracks 9 and 10 display the results for commercial milk sample 2. Tracks 12 to 14 were used for recovery studies with individual spiking of 1.4, 2.8, and 4.2 µg per spot individually over the milk sample spots. Track 14 shows the result of the analysis of the urea USP RS spot see Tables 2 & 3.
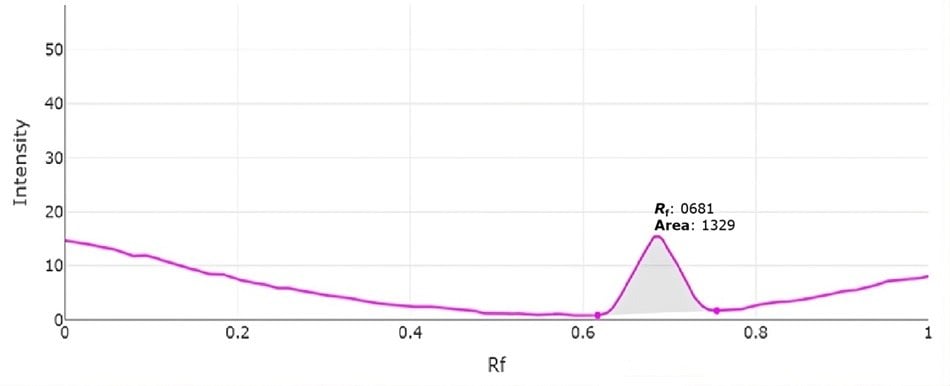
Figure 3.Representative video densitogram for the 4.9 µg per spot applied standard solution (track 6).
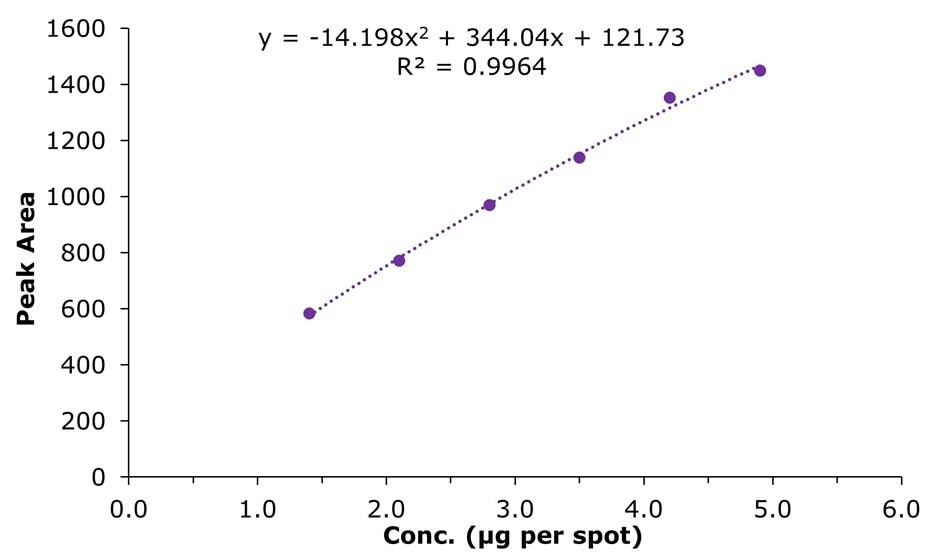
Figure 4.Calibration curve (polynomial) for urea in µg per spot vs peak area in the concentration range of 1.4 µg to 4.9 µg per spot (see also Table 3).
Conclusion
A method for the determination of urea in milk by TLC with derivatization and video densitometry using the TLC- Explorer analysis and documentation system was presented.
This developed method showed sufficient retention (Rf 0.68) and was evaluated in the concentration range from 1.4 µg per spot to 4.9 µg per spot, representing milk sample concentrations of 56 to 196 mg/100 mL. The calibration showed an R2 value of 0.9964 and spiking experiments showed recoveries ranging from 87.1 to 103.9%.
Thus, the here displayed method showed that TLC plates along with the TLC Explorer, are a viable option for a quick and efficient limit check for urea content in milk samples.
Reagents, Solvents , & Standards
References
如要继续阅读,请登录或创建帐户。
暂无帐户?