How to Optimize Downstream Process Development for Scale Up to a Multi Column Capture Chromatography System
As more productive upstream cell culture processes are developed, downstream purification steps can quickly become a bottleneck. Since the first reports of fully integrated protein production, biomanufacturers have been slow to adopt the technologies and solutions that could transform the productivity and speed of downstream processing. But things are changing.
Multi column chromatography for the capture step in a monoclonal antibody (mAb) process involves three columns working in series. At any point, two bind and elute columns are loaded in series, while the third column is washed, eluted and regenerated, the so-called non load steps. By loading two columns in series, each column can be overloaded, as any mAb not bound on the primary column will be captured on the secondary column. At a specified target, loading shifts to the second column which is now the primary column and the third ‘regenerated’ column becomes the secondary column, Figure 1. By overloading the primary column, utilization and productivity of capture resin can be increased by up to 65%.
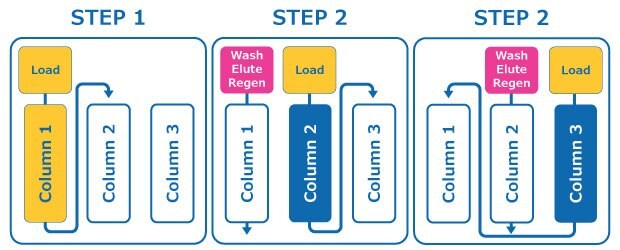
Figure 1.Multi column chromatography (MCC) workflow. MCC allows the simultaneous loading, wash, elution and regeneration of multiple columns.
Adopting a multi column chromatography (MCC) approach to the protein A capture step, improves productivity and reduces the amount of protein A resin needed for purification, lowering costs. The high cost of protein A resin makes the capture step a priority for process intensification and can produce economic benefits for both intensified fed-batch and perfusion processes. The benefits of MCC can be fully realized by implementing a fully automated single-use system, a key component of a shift towards Biopharma 4.0, where data analytics, automation, and control transform process control and compliance. But how to perform process development for scale up to a multi column capture chromatography system? Fortunately, representative process development for scale up to the Mobius® Multi Column Capture system can be easily performed on an ÄKTA Avant or pure systems typically used for batch chromatography process development.
This technical article will explain how you can approach bench scale studies for multi column capture chromatography with a familiar ÄKTA avant system to generate the information on process parameters needed for scale-up to a multi column capture chromatography system. We will focus on:
Generating a Breakthough Curve and Achieving Continuous Manufacturing
Similar to batch processes, multi column capture processes are designed to maximize yield and purity but also are designed to maximize media utilization and productivity while achieving continuous manufacturing. Data generated from the breakthrough curve on an ÄKTA system during process development provides process specific information for the MCC operation and a baseline for scale-up to the Mobius® Multi Column Capture System. Additional details are provided in our Application note.
Identify Mass Loading for Target % Breakthrough and Media Utilization
Maximum binding capacities (MBC) are more representative when calculated from a complete (100%) breakthrough (BT) curve generated at a long residence time on a wider bench-scale column (2.2 cm internal diameter) where possible. Collect samples from load, eluate and wash fractions as needed for analysis. We recommend:
- Generate BT curves at different residence time (RT) values (for example, 1, 2, and 3 mins) using a bench-scale column (with either purified mAb or clarified harvest). Load at least one column to 100% BT.
- Plot outlet mAb concentration (Y-axis) as a function of load volume (X-axis) for each RT evaluated, Figure 2.
- For each curve, integrate the breakthrough curve to quantify mass bound (area above curve) and mass unbound (area below curve).
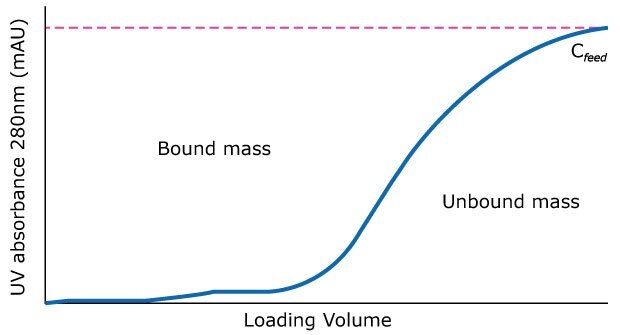
Figure 2.Chromatogram of a 100% BT curve for a given media and protein combination.
- For any given mass loading (g/L-media), use the bound mass values to calculate % media utilization: bound mass / maximum binding capacity (MBC).
- Using the calculated values for the primary column, plot % media utilization and % BT at different mass loadings (g/L-media), Figure 3.
- Use the unbound mass values from the breakthrough curve to calculate and plot mass loading (g/L- resinmedia) of the potential second capture column, Figure 3.
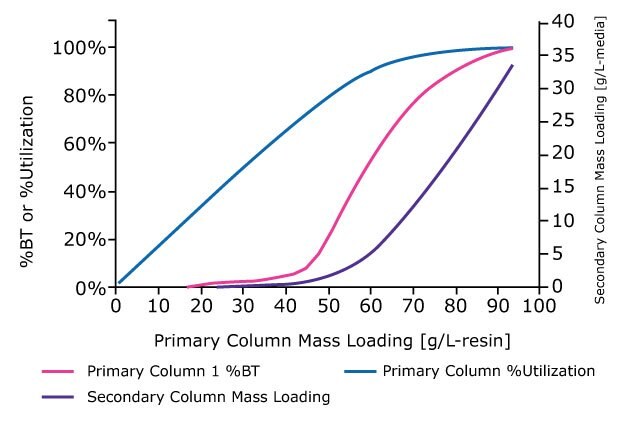
Figure 3.A breakthrough curve to 100% BT is analyzed to generate curves for % BT, utilization, and secondary column mass loading as a function of primary column mass loading.
Determine Load and Non-load Times to Assure Continuous Operation
The optimum RT for the process will maximize utilization and assure a continuous process with no breakthrough from the secondary column. Typical utilization is expected to be 80% or higher.
RT should maximize productivity (mAb bound/column volume (CV)/cycle time (where, cycle = load + non-load)) and enable a continuous operation where the time for load steps always exceeds the time for all non-load steps. Non load steps include wash, elution and regeneration steps. For each breakthrough curve generated at different RTs:
- Calculate non-load time by multiplying the total CVs of non-load steps with the RT of those steps.
- Calculate non load step time by multiplying the load CVs (from the mass loading calculations in the section above) by the RT of the load step.
- Use the calculated load and non load step values to identify the optimum RT for load and non load steps to maximize utilization and ensure synchronization and continuous operation.
Scale-Up
Columns of different sizes can be assessed during process development studies, but our results show that bench scale columns of at least 2.2 cm ID, are more representative of process scale columns in terms of mAb binding than smaller columns. This is likely due to differences in column aspect, wall effects or other system components.
Any data generated from process development with an ÄKTA system can be used to estimate column sizes, number of cycles and the buffer volumes required to enable efficient purification at process scale.
Calculating the Size of Columns Needed
- Calculate chromatography media CV needed based on flowrate and the target RT. For example, for a process with 2 L/min flowrate and a RT of 2 min, the CV would be 4 L.
- For any given CV of chromatography media, use media pressure/flow properties and available hardware dimensions, to determine column size. For example, a CV of 4 L could be 20 cm internal diameter (ID) x 13 cm bed height (BH) or 25 cm ID x 8 cm BH.
Calculate Number of Cycles & Buffer Volume Requirements
The number of cycles required to process a batch of drug depends on batch size, titer, CV, binding capacity primary column mass loading, and number of columns:

Buffer volumes required depends on buffer consumption, CV, and cycles per batch

Process development data generated on an ÄKTA system, should represent process scale performance from a multi column capture chromatography operation and can be used to predict process costs and potential savings that could be realized by transitioning from a batch process.
Contact us for help determining potential savings and benefits on converting to MCC.
Additional Process Characterization
To generate data on yield, product purity, impurity removal and media lifetime, additional process characterization studies can be performed with the ÄKTA system. The system should be configured to operate two bench-scale columns: the first represents the primary column of the process scale multi column process, and the second represents all columns beyond the primary column. The primary column should be overloaded with mAb while the second column is simultaneously preloaded.
- Create a flow path (with versatile valves) to enable the columns to be operated in series and individually.
- Load the primary column, preload the second column and then load the second column. Perform the non load steps (wash, elute and regeneration) for each column individually.
- Plot UV breakthrough from the primary column against mAb bound (g/L - media). Figure 4 shows results for process development columns of various ID.
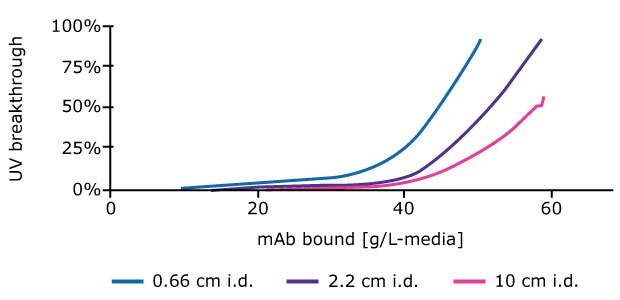
Figure 4.Mass of mAb binding to columns increases at a given % breakthrough value with increasing column ID.
As typical in any biomanufacturing facility, the batch of mAb used for process scale runs was different to that used for bench scale process development and characterization studies. Before starting process scale runs with the harvest material, a bench scale run was performed with the ÄKTA system: feed titer was 3.64 g/L, the % UV breakthrough target was 52% and the estimated load challenge was 49.7 g/L-media.
Process scale operations were performed for a total of nine cycles for the three columns: cycles 4-8 represent steady state operation, where all columns were preloaded with the breakthrough mAb. The 9th cycle was performed at a UV breakthrough of ~ 90% to estimate the maximum media binding capacity of the columns and was used to calculate the utilization at process scale.
Cycling was completed in 6.25 hours, at which point 340 g of mAb was processed with 90% yield. Figure 4 compares media utilization and bound mAb at both bench and process scales. Media utilization was comparable at both scales, but bound mAb appeared higher in the process scale studies. Further analysis of overloaded columns performed during bench scale process characterization studies revealed that the wider diameter columns were more representative of process scale performance, Figure 5.
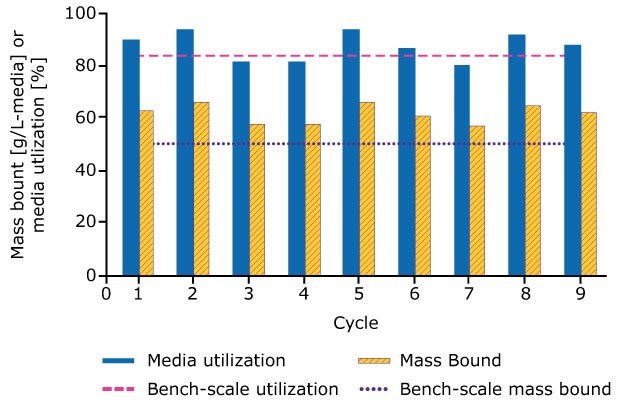
Figure 5.The mass bound and utilization of each cycle is calculated and compared to data from the bench-scale breakthrough experiment using a 2.2 cm i.d. column
Figure 6 compares host cell protein (HCP) removal, monomer level and process yield in the bench and process scale studies. Performance was consistent between bench scale studies using the ÄKTA system and process scale studies using automated multi column capture chromatography system. In addition, the process scale studies reveal consistent performance cycle to cycle.
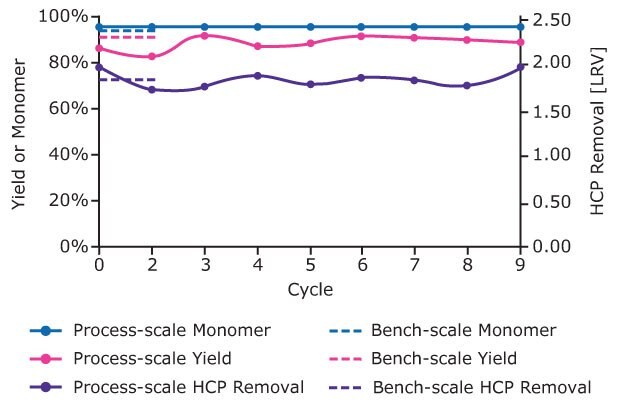
Figure 6.Yield, % monomer and HCP removal (LRV) for each cycle of the process scale operation with bench scale data for each attribute shown for comparison.
Performance Benefits of Multi Column Capture Chromatography
Productivity of each system was calculated based on batch size and titer, resin volume and processing time:

Productivity of the bench scale system was 31 g mAb/L- media/hr, which was comparable to that of the process scale at 32 g/L-media/hr.
Fill out our webform for additional information on the benefits of converting to MCC or to request a demo of the Mobius® Multi Column Capture system today!
Related Products
References
如要继续阅读,请登录或创建帐户。
暂无帐户?