Multiplex Detection of Four Alzheimer’s Disease Biomarkers in Human CSF Samples Using A Novel MILLIPLEX® Assay
Section Overview
- Why Should You Multiplex CSF Biomarkers of Neurodegeneration?
- Multiplexing Alzheimer’s Disease Biomarkers
- Methods
- Biomarker Detection Results
- Summary
- Materials
- References
Analyzing combinations of CSF biomarkers of neurodegenerative disease provides unique benefits. Read on to see how multiplex detection of these biomarkers, using the MILLIPLEX® Human Amyloid Beta and Tau Magnetic Bead Panel, allows for a different perspective on Alzheimer’s disease research.
Why Should You Multiplex CSF Biomarkers of Neurodegeneration?
Progressive neurodegenerative disorders, such as Alzheimer’s disease (AD), affect millions worldwide and are becoming more prevalent as our population ages. Two key neuropathological features that exemplify AD are extracellular Amyloid β (Aβ) plaques and intracellular neurofibrillary tangles, which are composed of the abnormally hyperphosphorylated protein Tau. Biochemical changes in Aβ and Tau reflect AD pathologic processes in the brain.
Monitoring Aβ, Tau, and other protein biomarkers in cerebrospinal fluid (CSF) of patients with these neurological disorders may be highly beneficial to understanding the pathological processes involved. Previous studies in which several protein biomarkers were monitored using a multiplexed panel showed that analyzing combinations of two or more CSF biomarkers (such as phosphorylated Tau [Thr181] in combination with Aβ1-42) provided a more accurate diagnosis of AD than any single CSF biomarker. 1,2
Multiplexing Alzheimer’s Disease Biomarkers
A multiplexed assay panel, the MILLIPLEX® Human Amyloid Beta and Tau Magnetic Bead Panel was developed to simultaneously quantitate levels of AD biomarkers: Aβ1-40, Aβ1-42, total Tau, and phosphorylated Tau (Thr181) in human CSF samples. Compared to other commercially available panels that do not include Aβ1-40, this 4-plex panel enables the determination of the Aβ1-40:Aβ1-42 ratio, which has also been suggested as crucial for AD pathogenesis. 3 In fact, many mutations associated with familial AD increase the Aβ1-40:Aβ1-42 ratio.
Methods
Human CSF samples from undiagnosed (normal) and AD individuals were acquired from Discovery™ Life Sciences and Precision Medicine, respectively. The multiplex assays for AD biomarkers were performed in 96-well plates according to product instructions supplied for the MILLIPLEX® Human Amyloid Beta and Tau Magnetic Bead Panel.
Biomarker Detection Results
The specificity of this kit was tested and showed no cross-reactivity nor any significant difference in analyte concentrations, regardless of whether each analyte was measured in a single-plex or multiplex (full 4-analyte kit) format (Table 1).
Table 1. Comparison of CSF sample concentration in single-plex vs. multiplex immunoassays. Measurement of human CSF sample values in single-plex bead and detection vs. 4-plex beads and detection in duplicates.
Furthermore, sensitivity, intra- and inter-assay precision, linearity of dilution, and spike recovery exhibited excellent analytical performance (Table 2).
Table 2. Assay performance characteristics. Inter-assay %CVs and intra-assay %CVs were calculated using positive controls from different assays. Percent spike recovery was calculated from spiked recombinant proteins in assay buffer and CSF samples. The average percent linearity was calculated from three diluted human CSF samples. Percent cross-reactivity was performed using single, purified recombinant proteins with multiplexed beads and detection cocktails. Minimum detectable concentration (MinDC) was calculated using MILLIPLEX® Analyst 5.1 Software.
Given the physicochemical characteristics of Aβ peptides, an investigation into whether the presence of Aβ peptides would interfere with the detection or quantitation of the other protein biomarkers when measured simultaneously was performed. An interference test was done (Figure 1) in which increasing concentrations of Aβ40 or Aβ42 recombinant proteins were spiked into human CSF samples. The measured concentrations of the analytes did not change, indicating that there was no detectable interference from the Aβ peptides.

Figure 1. MILLIPLEX® Human Amyloid Beta and Tau Magnetic Bead Panel interference test. Increasing concentrations of Aβ40 or Aβ42 recombinant proteins were spiked into human CSF samples (n=4). No significant differences in sample concentrations were detected.
Figure 2 shows CSF sample values plotted on standard curves.

Figure 2. CSF sample values plotted on standard curves using the MILLIPLEX® Human Amyloid Beta and Tau Panel. Aβ40, Aβ42, total Tau, and phosphorylated Tau (Thr181) concentrations from human CSF samples are plotted on the standard curves using this panel.
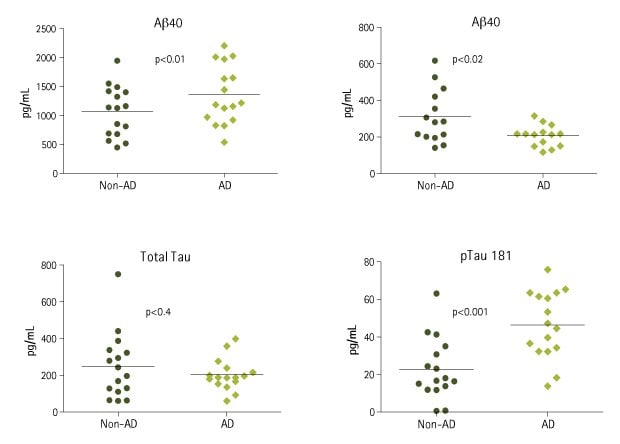
Using the MILLIPLEX® multiplex immunoassay kit, Aβ1-40, Aβ1-42, total Tau, and phosphorylated Tau (Thr181) were detected simultaneously in age-matched AD and non-AD human CSF samples (Figure 3), minimizing the use of valuable CSF samples (12.5 μL/well).

Figure 3. Multiplex measurement of human non-AD-CSF and AD-CSF samples. Non-AD-CSF samples (n=16) and AD CSF samples (n=16) were analyzed using the MILLIPLEX® Human Amyloid Beta and Tau Magnetic Bead Panel.
Phosphorylated Tau (Thr181) and Aβ1-42 correlated significantly with the presence of an AD diagnosis (p-value < 0.01 and p-value < 0.05, respectively). Neither total Tau nor Aβ1-40 showed a significant correlation with AD diagnosis in the CSF samples used in this study. The ratio of phosphorylated Tau (Thr181) over Aβ1-42 improved the p-value < 0.001. This result was consistent with published data indicating that the ratio of phosphorylated Tau (Thr181) to Aβ1-42 correlates with cognitive decline. 4
Summary
The MILLIPLEX® Human Amyloid Beta and Tau Magnetic Bead Panel is ideal for simultaneous measurement of Aβ1-40, Aβ1-42, total Tau, and phosphorylated Tau (Thr181) for neurodegenerative disease biomarkers in human CSF. This assay is rapid, sensitive, reproducible, and requires only 12.5 μL or less of CSF sample. It is important to note that the presence of either Aβ1-40 or Aβ1-42 does not interfere with the detection or quantitation of other biomarkers.
The ability to determine both the Aβ1-40:Aβ1-42 ratio as well as the Aβ1-42:phosphorylated Tau ratio indicates that this assay is a unique and powerful tool for studying the complexities of the nervous system and the mechanisms of pathology in AD and other neurodegenerative disorders.
See how to integrate multiplexing with ultrasensitive immunoassay technology for Alzheimer’s disease research.
Materials Table
References
如要继续阅读,请登录或创建帐户。
暂无帐户?