Qualitative Analysis of Fixed Oils acc. to USP General Chapter <202> (Method II) Using the TLC Explorer
Valanka D’Silva
R&D APAC Lab, Jigani, Bangalore, India
Abstract
This study presents a method to identify fixed oils by thin-layer chromatography (TLC) in accordance with USP General Chapter <202>. The TLC Explorer system enabled efficient chromatographic analysis and documentation. Results revealed deviations in certain market samples from reference standards, underscoring the critical role of quality assurance in fixed oils, which can be effectively supported by high-performance thin-layer chromatography (HPTLC).
Section Overview
Introduction
Fixed oils are lipids derived from plants that are essential in our daily diets, providing energy and supporting various biological functions. They contain numerous important components, including essential fatty acids, fat-soluble vitamins, nutrients, and sterols. In addition to their dietary applications, fixed oils play a vital role in pharmaceutical formulations, serving as carrier oils in ointments, injectables, and suppositories.1
The rising market demand for fixed oils has resulted in challenges related to adulteration and falsification, which undermine quality for increased profit margins. To address these issues, various chromatographic techniques, including HPTLC, HPLC, LC-MS, and GC-MS, have been utilized for chemical profiling and quality assurance of these oils.2
The United States Pharmacopeia (USP) general chapter <202> identifies thin-layer chromatography (TLC) as the method for the identification of fixed oils.3 TLC is frequently referenced in pharmacopeial methods for identity testing. High-performance thin layer chromatography (HPTLC) is an advanced version of TLC that is robust, reliable, rapid, and cost-effective for qualitative and quantitative analysis of different compounds. This technique provides chromatographic separations or fingerprints that can be visualized for identification and quantification and can also be saved as electronic images for documentation.4,5
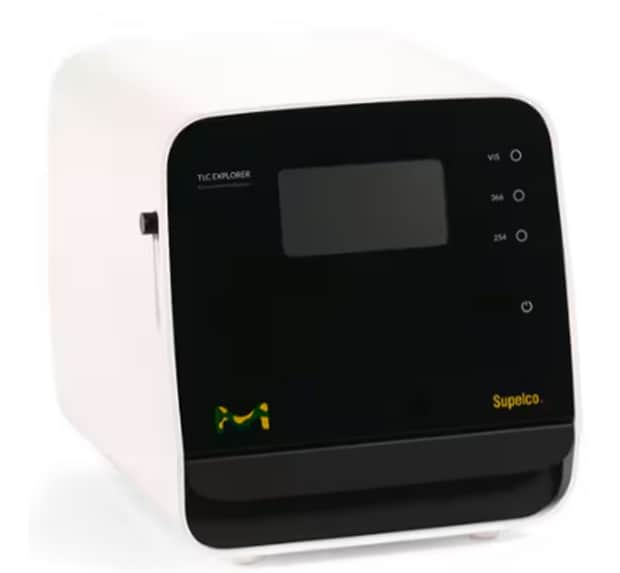
In this application note, the identification test for fixed oils by TLC, as specified in the USP general chapter <202> (Method II), is conducted using the new TLC Explorer documentation system (Figure 1).

Figure 1.TLC Explorer.
The TLC Explorer documentation system enables the digital and automated evaluation of TLC plates, enhancing the efficiency and accuracy of thin layer chromatography analysis. The device offers three illumination modes using LED light sources—white light (VIS), UV-A (366 nm), and UV-C (254 nm) – for the detection and fast measurement of the compounds of interest. The software offers special features like automated track recognition, simultaneous measurement of multiple plates and background signal correction. Overall, the TLC Explorer offers accurate TLC imaging for reliable densitometric measurements, enabling quantitative analysis and reliable data interpretation.
Experimental
Reagent Preparation
- Mobile phase: Mix methylene chloride, acetic acid glacial and acetone in a ratio of 20:40:50, v:v:v.
- Spray reagent (25 mg/mL phosphomolybdic acid in 96% alcohol): Dissolve 1.26 g of phosphomolybdic acid hydrate in 50 mL of 96% ethanol.
Standard Preparation
- System suitability solution 1: Dissolve 25 µL of the USP corn oil RS in 3 mL of methylene chloride.
- System suitability solution 2: Dissolve 25 µL of the USP olive oil RS in 3 mL of methylene chloride.
- Standard solutions I-XIV: Dissolve 25 µL of the USP reference standards of the fixed oils mentioned under Table 1 in 3 mL of methylene chloride.
Sample Preparation
Sample solutions I-XIV: Dissolve 25 µL of the market samples of the fixed oils mentioned under Table 1 in 3 mL of methylene chloride.
TLC Conditions
The 30 solutions were applied across two HPTLC glass plates (Silica gel 60 RP-18 F254S) and developed using the TLC method described in Table 2.
Results
System Suitability and Analysis
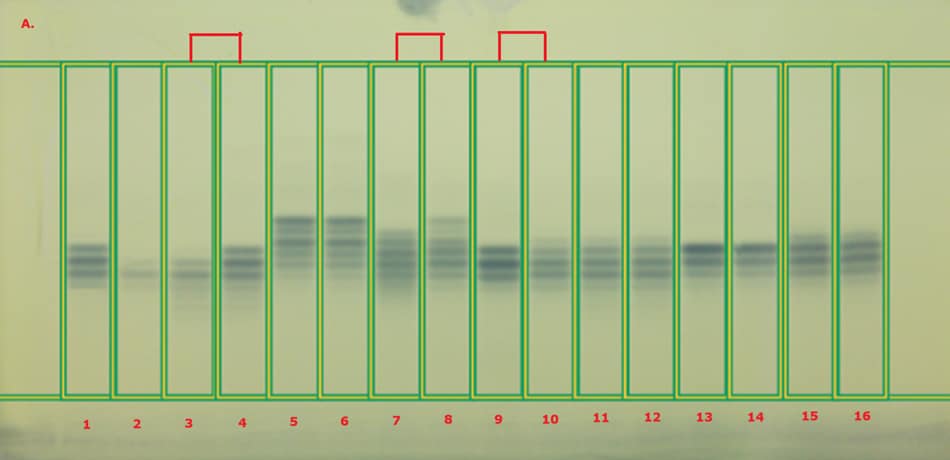
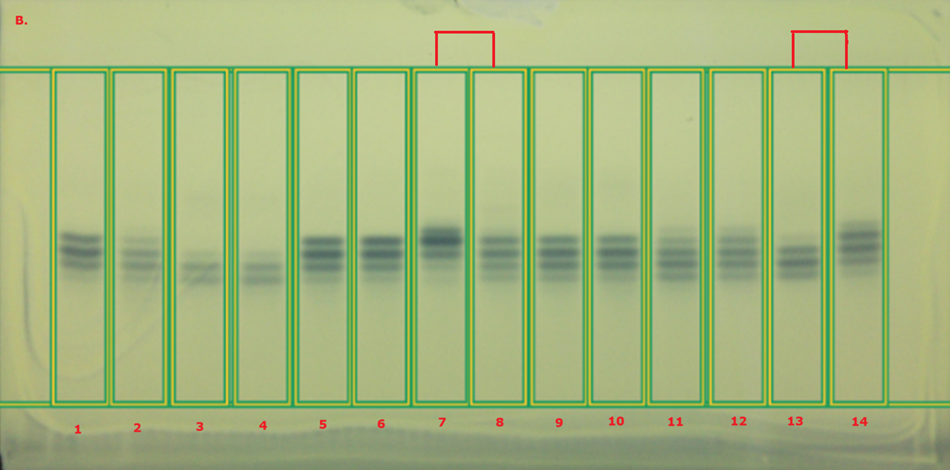
The identification of fixed oils performed according to USP general chapter <202> on the TLC Explorer under white light is demonstrated in Figure 2. Table 3 summarizes the system suitability results observed for USP corn oil RS and USP olive oil RS, while Tables 4 (a & b) summarize the obtained chromatographic results (retention factors, Rf) for the fixed oil reference standards and their respective market samples.


Figure 2. (A) TLC chromatogram of plate A demonstrating the system suitability studies using corn oil (track 1) and olive oil (track 2), as well as identification studies of fixed oil standards (odd track no.) and their market samples (even track no.) with tracks marked that showed deviations: peanut oil (tracks 3, 4), flaxseed oil (tracks 5, 6), borage seed oil (tracks 7, 8), cotton seed oil (tracks 9, 10), palm oil (11, 12), safflower oil (13, 14), and soybean oil (tracks 15, 16) under white light by the TLC Explorer; (B) TLC chromatogram of plate B demonstrating the identification studies of fixed oil standards (odd track no.) and their samples: corn oil (tracks 1, 2), olive oil (tracks 3, 4), sunflower oil (tracks 5, 6), evening primrose oil (tracks 7, 8), sesame oil (tracks 9, 10), canola oil (11, 12), and almond oil (13, 14) under white light by the TLC Explorer. (Oils where differences in the band pattern were observed between standard and market samples are marked on top of the tracks).
As required by USP general chapter <202>, the four principal spots obtained from corn oil (plate A, track 1) are clearly identified and separated, and the two principal bands obtained from olive oil (plate A, track 2, see also plate B track 3) are clearly identified and separated.
Tables 4a & 4b. Chromatographic data (Rf) observed for standard solutions and sample solutions on Plates A & B under white light by the TLC Explorer
Table 4a. Plate A
Table 4b. Plate B
Conclusion
A method was utilized for the identification of fixed oils using TLC in accordance with USP general chapter <202>. The assessment and the documentation of the chromatographic results were done with the TLC Explorer documentation system. The Rf values of the principal bands in the chromatogram obtained from most fixed oil sample solutions correspond to those obtained from the respective standard solution. However, the market samples for five oils, namely peanut oil (plate A, track 4) borage seed oil (plate A, track 8), cotton seed oil (plate A, track 10), evening primrose oil (plate B, track 8), and almond oil (plate B, track 14), exhibited differences in the band pattern from their respective USP RS standards (marked track sets in Figure 2).
This application note demonstrates that the TLC Explorer documentation system serves as an efficient TLC visualizer, enabling data capture, track identification, and Rf value calculation.
Find more information on the TLC Explorer Documentation System.
Reference Materials
References
如要继续阅读,请登录或创建帐户。
暂无帐户?