Validated Animal Component-Free Growth Factors for Cell Culture
Animal component-free (ACF) growth factors help promote cell growth without the safety risks that are sometimes associated with animal products, making them ideal for use in applications such as stem and cancer cell culture, immunological experiments, and antibody and vaccine development. Our collection of cell culture-validated, recombinant ACF growth factors have multiple benefits for cell culture experiments including:
- High bioactivity with low endotoxins
- Comparable (or higher) bioactivity versus animal-component containing recombinant growth factors
- Little to no lot-to-lot variations or import restrictions
- Reduced performance variability and consistent results
Enable a smooth transition towards novel clinical, pharmaceutical, biotech, and manufacturing applications with ACF growth factors. Click here to view our complete offering of ACF growth factors and cell culture-related reagents.
Epidermal Growth Factor (EGF) Protein, Human
- Catalog Number: E5036
- Source: Recombinant expressed in E. coli; Animal Component Free
- Purity: >97% (SDS-PAGE)
- Molecular Weight: ~6 kDa
- Bioactivity: 0.08–0.8 ng/mL EC50
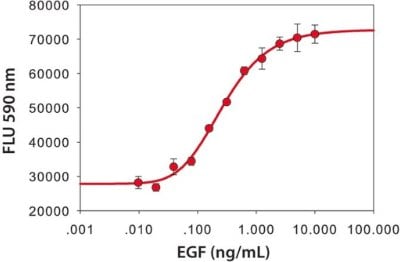
The biological activity was measured by the ability of E5036 to stimulate the mouse fibroblast cell line BALB/3T3.
EGF Human
- Catalog Number: E1235
- Source: Recombinant expressed in HEK 293; Xenobiotic Free (animal component-free)
- Purity: ≥95% (SDS-PAGE)
- Molecular Weight: 7.3 kDa (His-tagged)
- Bioactivity: 0.5-5 ng/mL EC50
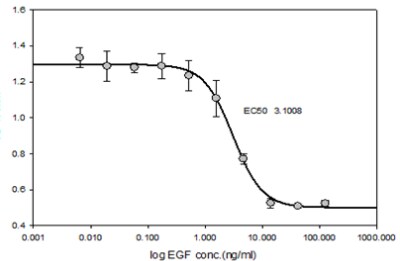
E1235 biological activity was tested in culture using human epithelial A431 cells. The EC50 is defined as the effective concentration that elicits a 50% increase in cell growth.
Tumor Necrosis Factor-α (TNF-α) Human
- Catalog Number: SRP3177
- Source: Recombinant expressed in E. coli; Animal Component-Free
- Purity: ≥95% (SDS-PAGE)
- Molecular Weight: 17.4 kDa
- Bioactivity: ≤ 0.10ng/ml EC50
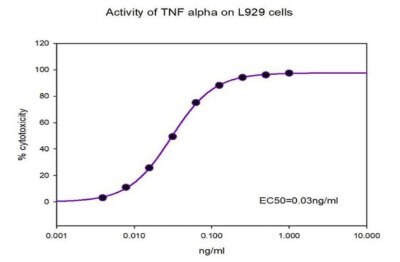
The biological activity of SRP3177 was tested in culture by cytotoxicity assay using L-929 mouse fibroblast cells in the presence of metabolic inhibitor actinomycin D. The EC50 is defined as the effective concentration that causes 50% cytotoxicity.
Tumor Necrosis Factor-α Human
- Catalog Number: H8916
- Source: Recombinant expressed in HEK 293; Xenobiotic Free (animal component-free)
- Purity: ≥95% (SDS-PAGE)
- Molecular Weight: 17.4 kDa
- Bioactivity: ≤1.0 ng/mL EC50
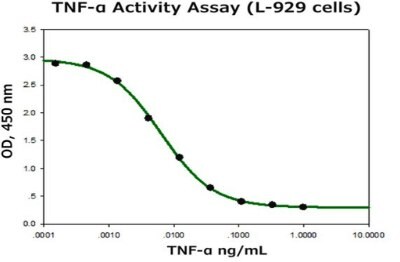
The biological activity of H8916 was tested in culture by measuring its ability to stimulate cytotoxicity of the TNF-α sensitive cell line L-929 in the presence of actinomycin D. The EC50 is defined as the effective concentration of TNF-α that elicits a 50% decrease in cell growth in a cell-based bioassay.
Interleukin-6 (IL-6) Human
- Catalog Number: SRP3096
- Source: Recombinant expressed in E. coli; Animal Component-Free
- Purity: ≥95% (SDS-PAGE)
- Molecular Weight: 20.9 kDa
- Bioactivity: ≤2.0 ng/mL EC50
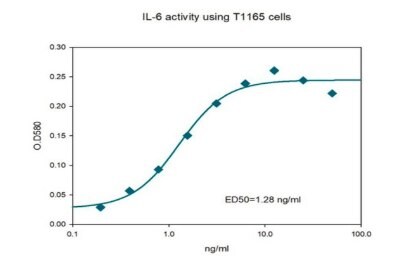
The biological activity of SRP3096 was tested in culture by measuring its ability to stimulate the proliferation of IL-6- dependent T1165 cells. The EC50 is defined as the effective concentration that elicits a 50% increase in cell growth.
Interleukin-6 (IL-6) Human
- Catalog Number: SCU0001
- Source: Recombinant expressed in HEK 293; Carrier Free
- Purity: ≥98% (SDS-PAGE)
- Molecular Weight: 20.8 kDa
- Bioactivity: 0.2-2 ng/mL EC50
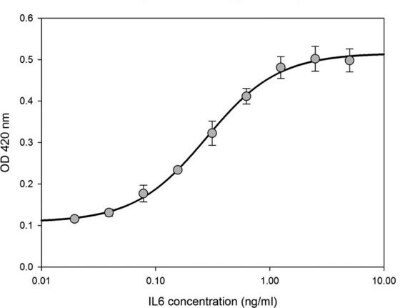
The biological activity of SCU0001 was measured in a cell proliferation assay using T1165 cells. The EC50 is defined as the effective concentration that elicits a 50% increase in cell growth in a cell-based bioassay.
Interleukin-2, Human
- Catalog Number: SRP3085
- Source: Recombinant expressed in E. coli; Animal Component-Free
- Purity: ≥95% (HPLC)
- Molecular Weight: 15.5 kDa
- Bioactivity: ≤0.5 ng/mL ED50
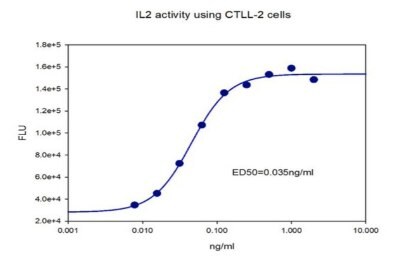
The biological activity of SRP3085 was tested in culture by measuring its ability to stimulate the proliferation of IL-2-dependent CTLL-2 cells. The EC50 is defined as the effective concentration that elicits a 50% increase in cell growth.
Transforming Growth Factor-β1 Human
- Catalog Number: H8541
- Source: Recombinant expressed in HEK 293; Xenobiotic Free (animal component-free)
- Purity: ≥95% (SDS-PAGE)
- Molecular Weight: 25 kDa
- Bioactivity: ≤0.5 ng/mL EC50
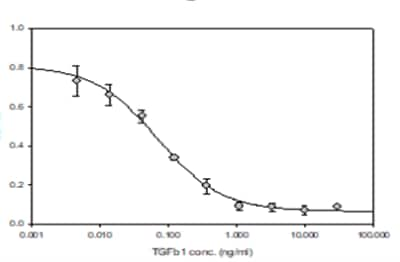
Biological activity of TGF-β1 was tested in culture measuring its ability to inhibit IL-4 induced proliferation of mouse HT-2 cells. The EC50 is defined as the effective concentration that elicits a 50% inhibition of cell proliferation.
Insulin Like Growth Factors (IGF-I) human
- Catalog Number: SRP3069
- Source: Recombinant expressed in E. coli; Animal Component-Free
- Purity: ≥95% (HPLC)
- Molecular Weight: ~7.6 kDa
- Bioactivity: 0.1-10 ng/mL ED50/EC50
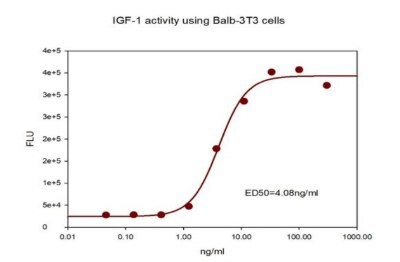
The biological activity of SRP3069 was measured by its ability to stimulate the proliferation of Balb 3T3 cells in serum-free medium. Cell viability was measured using Resazurin-based assay.
Erythropoietin Human
- Catalog Number: H5166
- Source: Recombinant expressed in HEK 293; Animal Component-Free
- Purity: ≥95% (SDS-PAGE)
- Molecular Weight: dimer 36 kDa
- Bioactivity: ≤5.0 ng/mL ED50
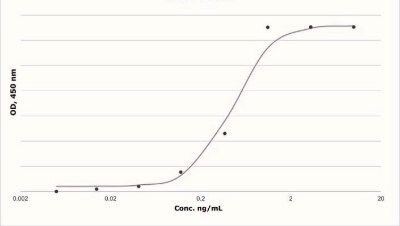
EC50 is defined as the effective concentration of H5166 that elicits a 50% cell proliferation in TF1 cell-based bioassay.
Granulocyte-Macrophage Colony-Stimulating Factor Human
- Catalog Number: SRP3050
- Source: Recombinant expressed in E. coli; Animal Component-Free
- Purity: ≥98% (SDS-PAGE)
- Molecular Weight: 14.6 kDa
- Bioactivity: ≤ 0,100 ng/ml ED50
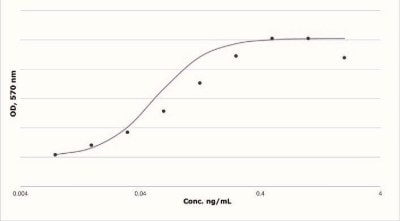
The EC50 is defined as the effective concentration of SRP3050 that elicits a 50% cell growth in TF1 cell-based bioassay.
Granulocyte-Macrophage Colony-Stimulating Factor Human
- Catalog Number: G5035
- Source: Recombinant expressed in E. coli; Carrier Free
- Purity: ≥98% (SDS-PAGE)
- Molecular Weight: 14.6 kDa
- Bioactivity: ≤0.1 ng/mL EC50
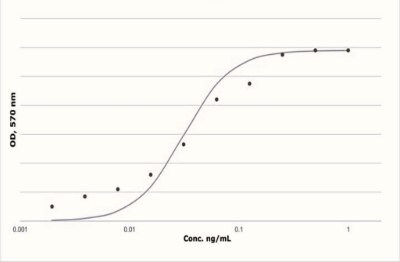
The EC50 is defined as the effective concentration of G5035 that elicits a 50% increase of alkaline phosphatase in TF1 cell-based bioassay.
Related Products
如要继续阅读,请登录或创建帐户。
暂无帐户?