Analysis of Vitamins D2 and D3 in Infant Milk Powder by LC-MS/MS According to GB 5009.296-2023
Jack Wang
R&D APAC lab, Shanghai, China
Abstract
An isotope dilution LC-MS/MS method employing a UHPLC column packed with 2 µm superficially porous particles was developed for the simultaneous detection of vitamins D2 and D3 in infant milk powder according to the GB 5009.296-2023 standard. Saponification and solid-phase extraction were utilized to effectively overcome matrix challenges, allowing for a rapid and accurate quantification. The method fulfilled all requirements stated in GB 5009.296-2023 for linearity, reproducibility, recovery, and sensitivity.
Section Overview
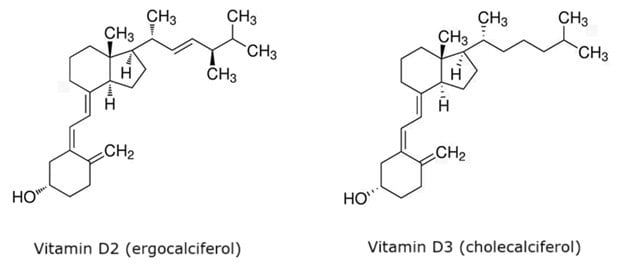
Figure 1.Chemical structures of vitamin D2 (ergocalciferol, CAS: 50-14-6) & vitamin D3 (cholecalciferol, CAS: 67-97-0).
Vitamin D is a fat-soluble vitamin essential for regulating calcium metabolism and maintaining bone health. It exists in two forms: vitamin D2 (ergocalciferol) and D3 (cholecalciferol) (Figure 1). While both forms exhibit the same physiological effects, vitamin D3 is considered more effective at increasing the serum 25(H)D levels.1 Currently, the primary methods for vitamin D analysis include high-performance liquid chromatography and high-performance liquid chromatography-tandem mass spectrometry (LC-MS/MS).
In this study, isotope dilution LC-MS/MS using a 2 µm superficially porous particle UHPLC column was used to simultaneously detect vitamins D2 and D3 in infant milk powder. Infant milk powder typically contains low levels of vitamin D, and its complex sample matrix poses challenges for sample preparation and separation, making it potentially difficult to distinguish between vitamin D2 and D3.
Sample preparation was performed according to the GB 5009.296-2023 standard, “National Standards for Food Safety Determination of Vitamin D in Food”. Following saponification extraction, the infant milk powder extract was further cleaned up using silica gel-based solid-phase extraction (SPE) prior to analysis by LC-MS/MS. This method was found to effectively isolate trace amounts of vitamin D from complex matrices, thereby facilitating a rapid and accurate determination of vitamin D content in food samples such as the infant milk powder examined in this study.2-5
Experimental
The analysis was performed in accordance with the GB 5009.296-2023 method using the procedures detailed below.
Reagent Preparation
- Potassium hydroxide solution (50 %): Dissolve 50 g potassium hydroxide in 50 g water, allow to cool to room temperature, and store in a polyethylene bottle.
- BHT-ethanol solution (0.2 g/100 mL): Prepare freshly, by dissolving 1.0 g 2,6-di-tert-butyl-4-methylphenol (BHT) in 500 mL anhydrous ethanol.
- Ethyl acetate - n-hexane solution (1+19): Mix ethyl acetate and n-hexane at a volume ratio of 1:19.
- Ethyl acetate - n-hexane solution (3+17): Mix ethyl acetate and n-hexane at a volume ratio of 3:17.
- Mobile phase A (0.05% formic acid in 5 mmol/L ammonium formate aqueous solution): Weigh 0.315 g ammonium formate, dissolve in 1000 mL water, add 0.5 mL formic acid, and mix well.
- Mobile phase B (0.05% formic acid -5 mmol/L ammonium formate methanol solution): Weigh 0.315 g ammonium formate, dissolve in 1000 mL methanol, add 0.5 mL formic acid, and mix well.
Standard Preparation
Keep all prepared single-compound and mixed solutions at –18 °C, protected from light. Store according to the times indicated below.
Single component solutions
- Vitamin D2 standard solution I (1000 mg/L): Accurately weigh 50 mg vitamin D2 standard into a beaker, dissolve in anhydrous ethanol, and transfer to a 50 mL volumetric flask. Adjust volume to the mark with anhydrous ethanol and mix well. Transfer the solution into an amber glass reagent bottle. Store for up to six months.
- Vitamin D2 standard solution II (100 mg/L): Pipette 10.00 mL vitamin D2 standard solution I into a 100 mL volumetric flask, adjust volume to the mark with methanol, and mix well. Store for up to three months.
- Vitamin D3 standard solution I (1000 mg/L): Accurately weigh 50 mg vitamin D2 standard into a beaker, dissolve in anhydrous ethanol, and transfer to a 50 mL volumetric flask. Adjust volume to the mark with anhydrous ethanol and mix well. Transfer the solution into an amber glass reagent bottle. Store for up to six months.
- Vitamin D3 standard solution II (100 mg/L): Pipette 10.00 mL vitamin D3 standard solution I into a 100 mL volumetric flask, adjust volume to the mark with methanol, and mix well. Store for up to three months.
- Vitamin D2-d3 standard solution (100 mg/L): Pipette 1.00 mL of a vitamin D2-d3 standard solution (1000 mg/L) into a 10 mL volumetric flask, adjust volume to the mark with methanol, and mix well. Store for up to three months.
- Vitamin D3-d3 standard solution (100 mg/L): Pipette 1.00 mL of a vitamin D3-d3 standard solution (1000 mg/L) into a 10 mL volumetric flask, adjust volume to the mark with methanol, and mix well. Stored for up to three months.
Mix solutions
- Mixed vitamin standard solution (vitamin D2 and D3 concentration 1.00 mg/L each): Pipette 1.00 mL vitamin D2 standard solution II and 1.00 mL vitamin D3 standard solution II into a 100 mL volumetric flask, adjust volume to the mark with methanol, and mix well. Store the solution for up to one month.
- Mixed internal standard solution (Vitamin D2-d3 and vitamin D3-d3 concentrations 1.00 mg/L each): Pipette 100 μL each of vitamin D2-d3 standard solution and vitamin D3-d3 standard solution into a 10.0 mL volumetric flask. Fill to the mark with methanol and mix well. Stored the solution for up to one month.
Calibration solutions
Calibration solutions (nos. 1-5): Pipette 0.10 mL, 0.50 mL, 1.00 mL, 1.50 mL, and 2.00 mL, respectively, of mixed standard solution into separate 10 mL amber glass volumetric flasks. Add 1 mL of mixed internal standard solution to each flask. Adjust the volume to the mark with methanol and mix well. The final concentrations of vitamins D2 and D3 are 10.0 μg/L, 50.0 μg/L, 100 μg/L, 150 μg/L, and 200 μg/L, respectively, with each deuterated vitamin at 100 μg/L. Prepare these working solutions immediately prior to use.
Sample Preparation
- Sample: Infant formula milk powder used for the study was obtained from a local supermarket and did not contain vitamins D2 and D3 (based on the label).
Note: This sample was used as a blank sample for method validation experiments, and no background levels of vitamin D2 & D3 were detected in subsequent analysis. - Extraction: 1 g infant milk powder was weighed into a 50 mL centrifuge tube. Subsequently, 100 μL of the mixed internal standard solution, 0.4 g of ascorbic acid, and 10 mL water at 40-45 °C were added. The mixture was shaken for 1 min. A 10 mL BHT-ethanol solution (0.2 g/100 mL) was then added and shaken for 1 min, followed by the addition of 5 mL potassium hydroxide solution (50 %), and mixed thoroughly. Saponification was carried out in a thermostatic reactor at 80±2 °C for 30 min. Immediately after saponification, the mixture was cooled down to room temperature (25±5 °C) in a cold-water bath. To the cooled down mixture, 20 mL n-hexane was added, and the mixture was shaken for 3 min, followed by centrifugation at 8000 rpm for 5 min. The upper layer was transferred to a 50 mL centrifuge tube, 25 mL water was added, the mixture was shaken for 1 min, and then centrifuged at 8000 rpm. The final sample extract was collected as the upper hexane layer.
- Cleanup: A Supelclean™ LC-Si SPE tube (6 mL/500 mg, 505374) was conditioned with 8 mL ethyl acetate, followed by 8 mL n-hexane. The sample extract was loaded onto the SPE tube and sequentially eluted with 6 mL of mixed ethyl acetate-n-hexane solution (1+19) and 6 mL of mixed ethyl acetate-n-hexane solution (3+17). The eluate was evaporated to dryness under nitrogen at 40 °C. The residue was reconstituted in 1.0 mL of methanol, ultrasonicated for 1 min, gently shaken for 1 min, and then filtered through a 0.22 μm PES filter membrane/syringe filter to obtain the final sample for analysis (Table 1).
Recovery and Precision
Two samples were prepared from separate 1.0 g portions of infant dairy product samples, which were spiked with 125 and 200 μL of the mixed vitamin standard solution, respectively. The resulting vitamin concentrations in these samples were 125 µg/kg and 200 µg/kg, respectively.
LC-MS/MS Method
The sample extract was analysed by LC-MS/MS using a 2 µm superficially porous particle Ascentis® Express 90 Å C18 column with multiple reaction monitoring (MRM).
Results & Discussion
Infant formula milk powder was extracted as described in the sample preparation section. Quantification of vitamins D2 (VD2) and D3 (VD3) was performed using an internal calibration (isotope dilution) approach with LC-MS/MS detection. The method performance was assessed by evaluating calibration linearity, precision, recovery, and sensitivity. Additionally, an actual infant formula milk powder sample was analyzed to demonstrate applicability.
The analysis on an Ascentis® Express 90 Å C18 2 µm column resulted in separation that was close to baseline under the selected conditions. The chromatogram obtained from the LC-MS/MS analysis of the vitamin D2 and vitamin D3 calibration solution 5 (200 μg/L) is shown in Figure 2, with the corresponding chromatographic data summarized in Table 2.
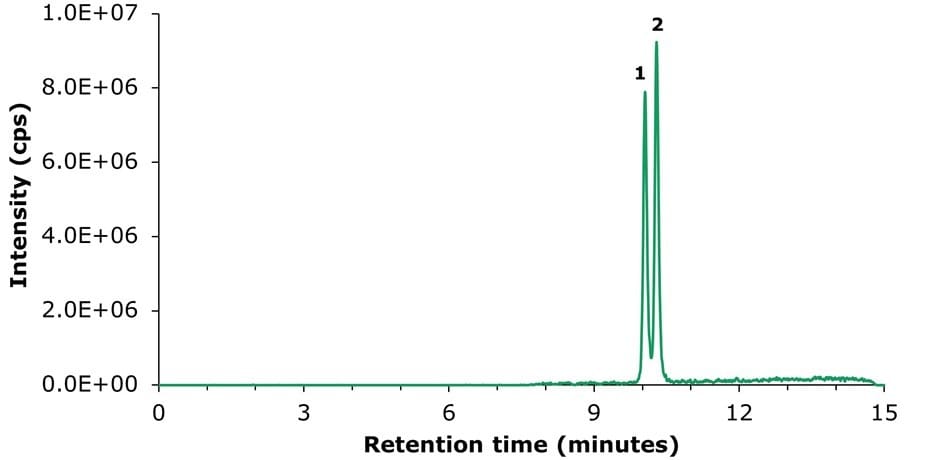
Figure 2.LC-MS/MS TIC chromatogram obtained for vitamins D2 (peak 1) and D3 (peak 2) calibration solution 5 (200 μg/L).
Calibration
The results obtained for the injected external calibration solutions in the range of 10-200 µg/L are shown in Figure 3 and Table 3. The linearity (R2) was determined to be 0.9992 (Vitamin D2) and 0.9998 (Vitamin D3), meeting the GB 5009.296-2023 criteria of ≥ 0.9980.
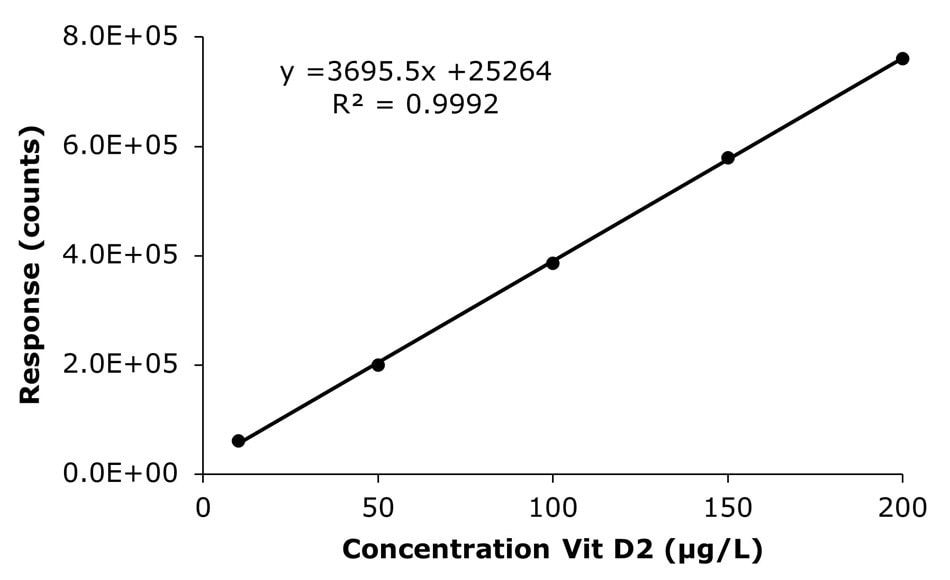
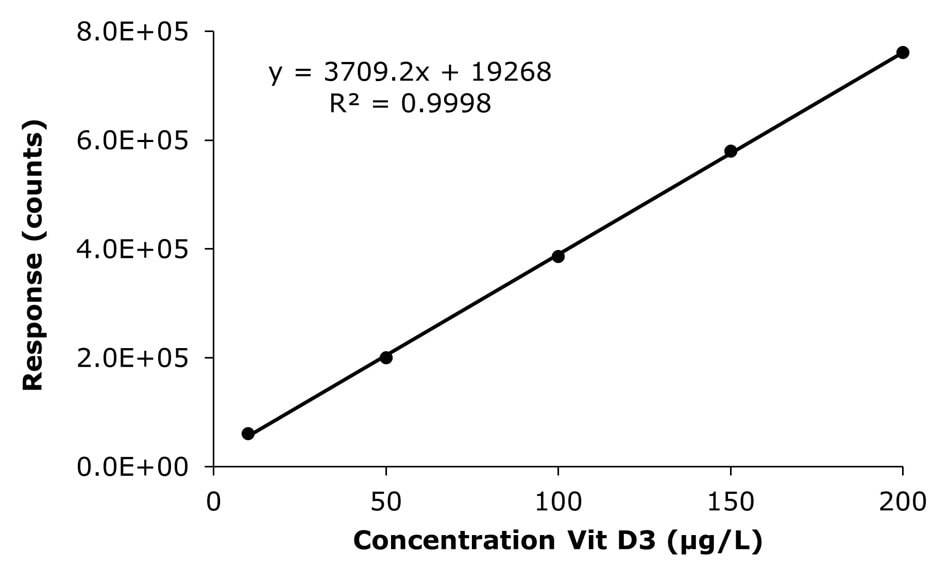
Figure 3. Calibration curves for vitamins D2 & D3 obtained by the analysis of calibration solutions 1-5 (10, 50, 100, 150, and 200 μg/L).
Data Precision and Recovery
To determine method precision, a sample spiked at a concentration of 125 µg/kg for vitamin D2 and vitamin D3 was used (Figure 4). The precision results, summarized in Table 4, showed a relative standard deviation (RSD) of 2.63% for vitamin D2 and 4.41% for vitamin D3, meeting the GB 5009.296-2023 specification of ≤ 20%.
The results of the recovery experiment, conducted using a sample spiked at 200 µg/kg of vitamins D2 and D3 in infant formula milk powder, are presented in Table 5. Recoveries of 87.6% for vitamin D2 and 88.3% for vitamin D3 were obtained, complying with the GB 5009.296-2023 required range of 70–110%. The blank milk powder sample used in these experiments showed no detectable background of vitamins D2 & D3 (Figure 5).
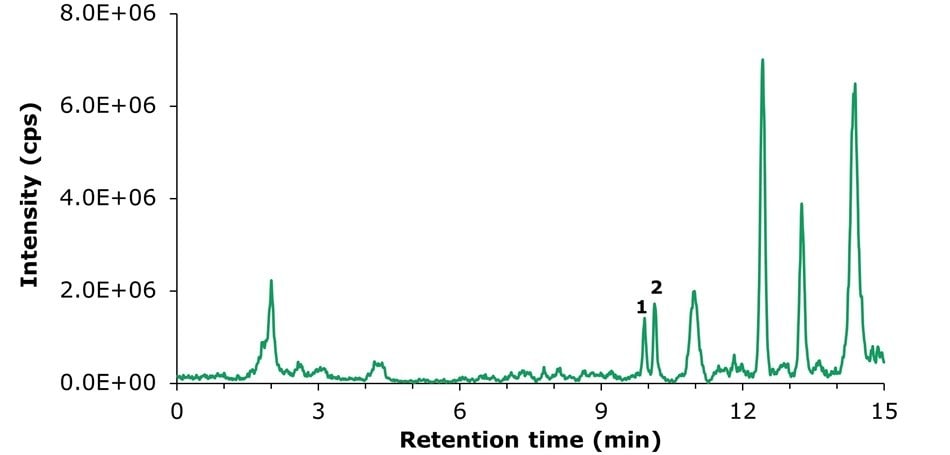
Figure 4.LC-MS/MS TIC chromatogram obtained for an infant formula milk powder sample spiked at 125 µg/kg with vitamins D2 and D3.
Sensitivity
For the determination of sensitivity of the LC-MS/MS method, the baseline noise of a blank infant milk powder sample was used (Figure 5). A value of 3N/X was applied to calculate the limit of detection (LOD), and 10N/X was applied to calculate the limit of quantification (LOQ). The resulting LODs and LOQs for vitamins D2 and D3 achieved using this LC-MS/MS method met and exceeded the requirements specified in the GB method (Table 6).
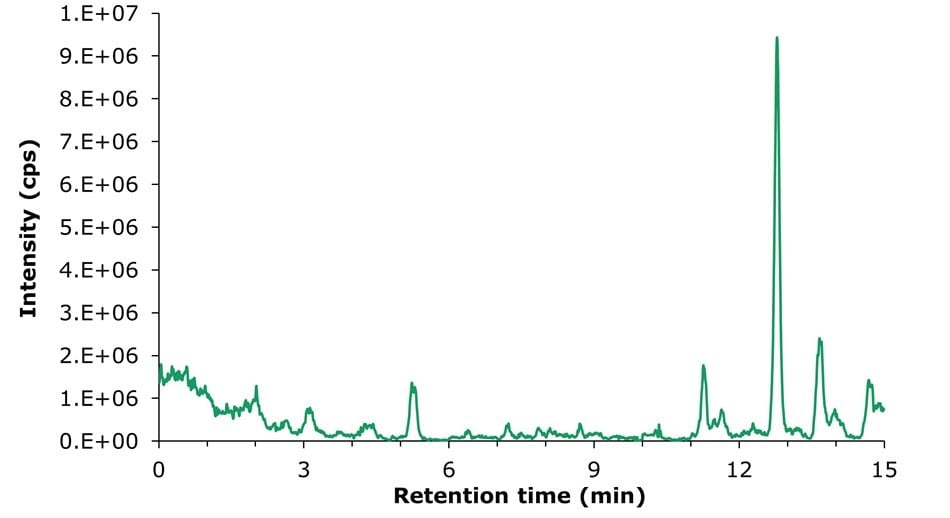
Figure 5.LC-MS/MS TIC chromatogram obtained for an unspiked infant formula milk powder sample.
Conclusion
A method for the simultaneous determination of vitamins D2 and D3 in infant milk powder was established in accordance with the GB 5009.296-2023 standard. The sample was prepared using saponification, solvent extraction, and solid-phase extraction cleanup. Analysis was performed by UHPLC-MS/MS using an Ascentis® Express 90 Å C18 2 µm superficially porous particle column with stable isotope-labeled standards for internal calibration. The sample preparation method effectively eliminated interferences and reduced the matrix effects. The developed method satisfied all requirements specified in the GB 5009.296-2023 standard with respect to linearity, reproducibility, recovery, and sensitivity.
Solvents, Reagents & Consumables
Reference Materials
References
如要继续阅读,请登录或创建帐户。
暂无帐户?