Direct upstream monitoring with Raman ready-to-use models
The bioprocessing industry continuously seeks innovative solutions to enhance process monitoring and control, particularly in upstream processes, with reliable and quick-to-implement solutions. Raman spectroscopy is an increasingly adopted Process Analytical Technology (PAT) tool for bioprocess monitoring, enabling in-line, real-time monitoring of Critical Process Parameters (CPPs) such as glucose and lactate concentrations, and Critical Quality Attributes (CQAs) such as protein titer.
- Challenges of Raman Spectroscopy Implementation
- Streamlining Upstream Monitoring with Ready-to-use Raman Models
- Optimizing Cell Culture Monitoring with Raman
- Monitoring with Plug-and-Play Raman Models
- Improving Raman Model Accuracy with a Transfer Learning Algorithm
- Enhancing Process Efficiency and Product Quality Through Real-time Monitoring
Challenges of Raman Implementation
To effectively apply this technology to process monitoring, a calibration phase is required. This involves the development of chemometric models to correlate the Raman spectra with reference measurements of the parameters of interest, typically across multiple batches for high reliability and accuracy. However, this model building process can be resource-intensive and time-consuming. Additionally, generating sufficient data to calibrate robust multivariate models is challenging due to the complexity of bioprocesses and biological variabilities, which can lead to data scarcity. These factors may hinder the implementation of Raman technology for some users.
Streamlining Upstream Monitoring with Ready-to-use Raman Models
Ready-to-use models embedded into the Raman analyzer simplify the standard calibration workflow by eliminating lengthy calibration phases. Users can bypass extensive model development and proceed directly to monitoring for immediate insights. This case study outlines the performance of embedded models applied during a fed-batch cell culture run for real-time measurement of glucose, lactate, and monoclonal antibody (mAb) titer. Following the initial run, the models were updated using a proprietary Transfer Learning Algorithm (TLA) that incorporated data from that run to enhance accuracy and extend monitoring capabilities to additional parameters. The performance of all three parameters was validated, yielding relative errors of 12–15% for the initial ready-to-use models, and 6–12% after refinement with the TLA.
Optimizing Cell Culture Monitoring with Raman
The cell culture batches were conducted using a CHO DG44 cell line and EX-CELL® Advanced CHO Fed-batch Medium with Cellvento® ModiFeed Prime COMP chemically defined feed. The cells were cultivated in a 1 L glass bioreactor over14-day period as a fed-batch process. A total of 26 samples were manually collected from the first batch as off-line references, and 23 samples from the second batch, to measure the concentrations of the targeted parameters, including glucose, lactate (BioProfile® Flex2, Nova Biomedical, Waltham, MA, USA), and mAb titer (Octet® K2 for Protein A, Pall Corp., Port Washington, NY, USA). Viable Cell Density (VCD) was also monitored (Vi-CELL XR, Beckman Coulter, Inc., Brea, CA, USA).
Raman spectroscopy
The ProCellics™ Raman Analyzer was used in a single channel configuration. The instrument has a 785 nm laser with laser power around 350 mW at the probe-tube output. The probe tube of 225 mm immersion length obtained measurements directly within the bioreactor using PG13.5 port adaptors. For this study, the bioreactor was protected from all light sources to avoid any potential interference. Spectral data acquisition, reference association, and data processing were controlled using Bio4C® PAT Raman Software and its Bio4C® PAT Chemometric Expert module. The Bio4C® PAT Raman Software’s advanced features of straylight noise detection and removal were activated during the batches to mitigate any potential impact of external light in case of incomplete cover of the bioreactor.
For additional information on straylight detection, please download our application note Monitoring bioprocesses in a light environment using Raman spectroscopy.
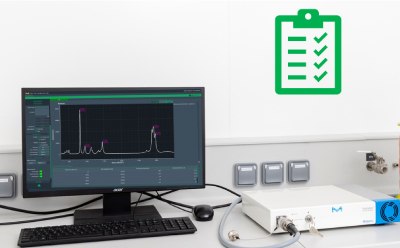
A total acquisition time of 8.5 minutes was determined per measurement, consisting of an integration time of 17 seconds and an average of 30 spectra. As shown in Figure 1, a standard IQ/OQ was performed before the first run to ensure proper qualification of the instrument. The system was delivered with pre-installed embedded models, making it immediately ready-to-use for real-time measurements.
Day 1
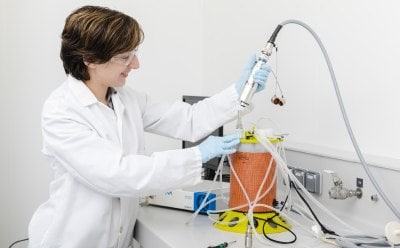
Day 2
Day 3
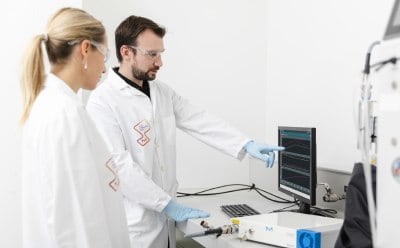
Figure 1: Workflow showing the plug-and-play implementation of ProCellics™ Raman Analyzer: unpacking, installing the system and running its qualification can be easily done in a few hours; the second day can be dedicated to sterilizing the probe and its set-up it with the bioreactor; real-time monitoring of the process is finally possible from day 3 of the experiment.
Monitoring with Plug-and-Play Raman Models
Figure 2 illustrates the use of the ready-to-use models for monitoring the three target parameters (glucose, lactate and mAb titer). In summary:
- Glucose: The in-line Raman measurements demonstrated good performance in capturing the feeding strategy and overall glucose kinetics with 14% relative error. A one-point calibration based on the first off-line reference effectively mitigated slight biases from the process. As a result, this approach achieved an impressive accuracy of 94% (6% residual error), demonstrating the strong capability of the ready-to-use model for the glucose parameter.
- Lactate: The in-line Raman readings were closely aligned with the off-line references during the cell growth phase up to day 11, achieving a relative error of 15%. After day 11, the model had difficulty accurately tracking the continued rise in lactate level. This late stage of the process has shown a decrease in VCD, which is indicative of cell death. This decline in cell viability likely contributed to the discrepancies observed in the measurements during this period.
- mAb Titer: The in-line Raman readings for mAb titer were consistent with the off-line reference measurements. Although there were minor variations in the kinetics, the overall relative error was 12%, indicating satisfactory accuracy for real-time monitoring of this quality attribute throughout this first process.
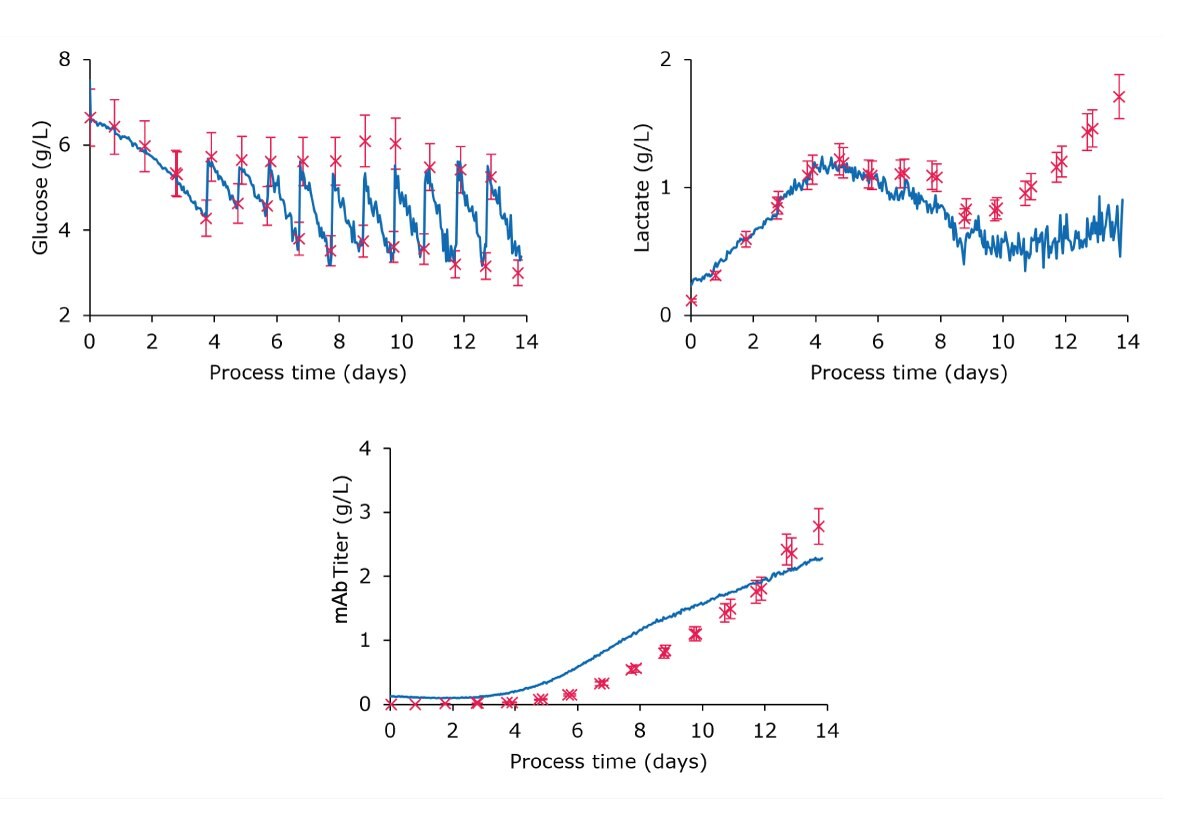
Figure 2:Monitoring plots comparing the embedded real-time Raman monitoring values (blue continuous lines) to off-line references (red crosses) of glucose, lactate, and mAb titer, demonstrating the good correlation of the measurement data.
From the first batch, the plug-and-play solution enables capture of monitoring trends comparable to those achieved through offline analysis, giving scientists the ability to gather valuable process information right from the start.
Improving Raman Model Accuracy a with Transfer Learning Algorithm
For the second batch, the initial embedded models were refined using the Transfer Learning Algorithm (TLA), leveraging data from the first monitoring run to further improve monitoring accuracy. Additionally, the TLA solution allows monitoring of VCD by leveraging spectral data and off-line reference values from the first batch to extend the scope of monitoring. The second batch monitoring plots are displayed in Figure 3 below, with the following results:
- Glucose: The refined glucose model effectively captured the feeding strategy and showed significant improvement, achieving a relative error of 6% in real-time monitoring, without any calibration needed.
- Lactate: The updated model provided acceptable performance during the first days of cell growth and improved monitoring during the plateau phase. It achieved a good relative error value of 12% over the whole process duration, with an improved relative error of 9% when considering the process up to day 9.
- mAb Titer: The refined model showed enhanced accuracy with a relative error of 9%, down from the already good 12% error obtained during the initial monitoring run with the plug-and-play strategy.
- VCD: The model demonstrated an enhanced ability to monitor VCD up to 30 Mcells/mL with a relative error of 8%, benefiting from the one-point calibration approach based on the inoculation reference value.
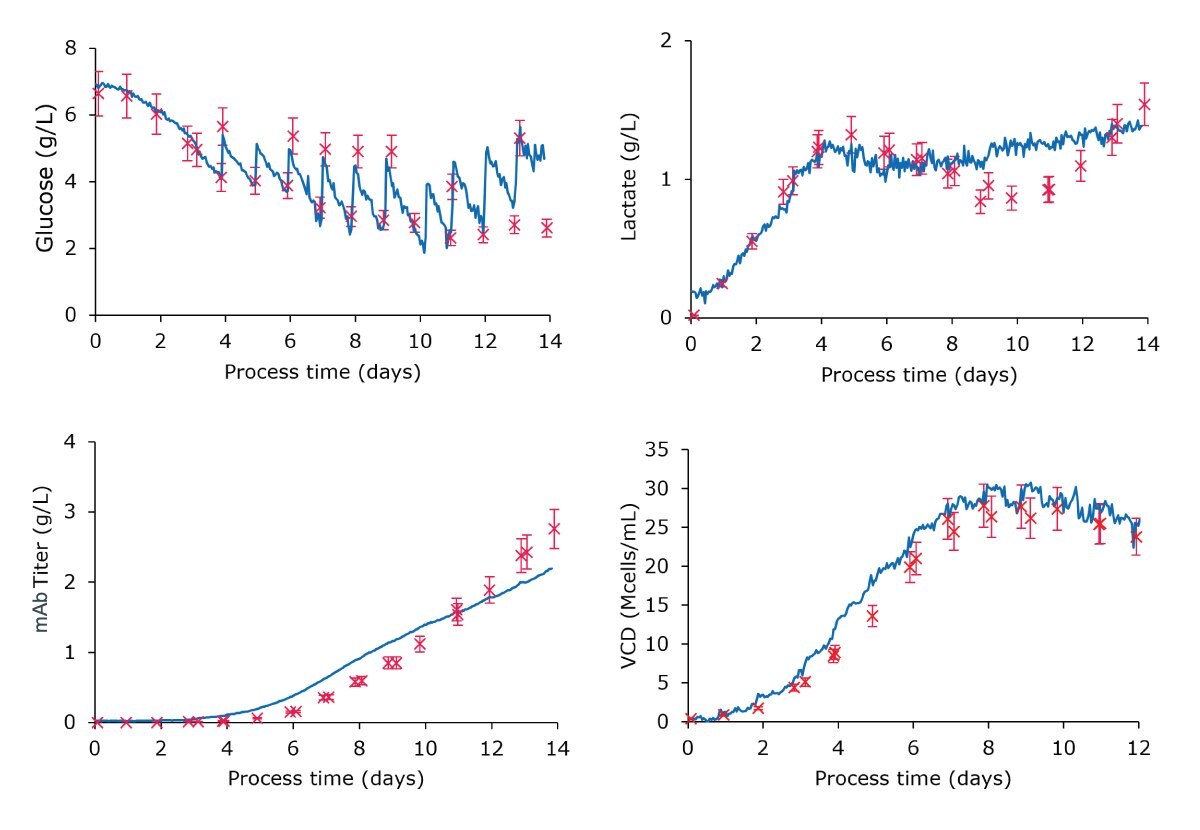
Figure 3:Monitoring plots comparing the embedded real-time Raman monitoring values to off-line references of glucose, lactate, mAb titer, and viable cell density using the refined models. The data sets show good correlation of the off-line and in-line real-time measurements.
The refinements made to the embedded models, using data from the first monitoring batch and the TLA algorithm, enabled more accurate monitoring right from the start of the second batch.
The presented case study has successfully demonstrated that it is possible to achieve above 85% accuracy overall on key parameters out of the box, with the potential for quick refinement of the models to further improve accuracy in subsequent batches.
This is especially beneficial during the latter stages of the process, leading to more reliable data for decision-making in bioprocess management.
Accurate Real-time Monitoring of Critical Quality Attributes (CQAs)
The resulting summary table of performances and bar graph summary plots are respectively shown in Table 1 and Figure 4 below.
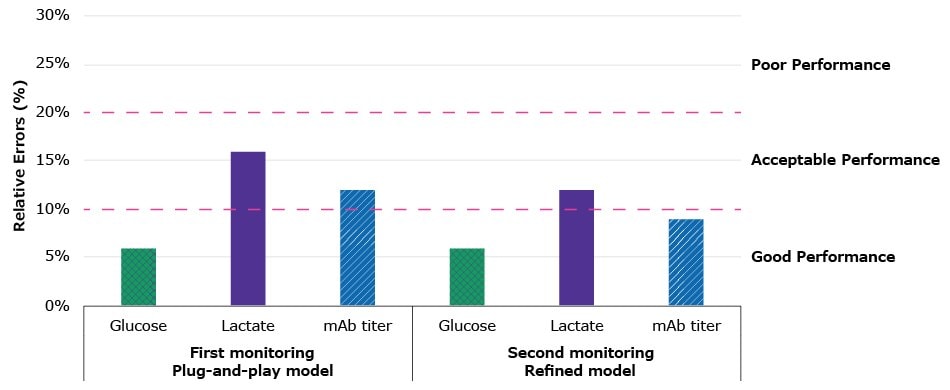
Figure 4:Bar chart visualizing the relative errors presented in Table 1, comparing the ready-to-use models to the refined models: the ready-to-use models monitoring the first batch show good performance for glucose and acceptable performance for lactate and mAb titer; the refined models applied to the second batch allow even more accurate monitoring with good performances for glucose and mAb titer and again acceptable, but improved performance for lactate.
This application note highlights the effectiveness of the ready-to-use embedded models of ProCellics™ Raman Analyzer in monitoring CPPs and CQAs during upstream bioprocessing, achieving over 85% accuracy across glucose, lactate and mAb titer parameters. These models are ready-to-use on the first batch, requiring no additional efforts from the end user. The insights gained from the initial batch informed refinements for the second batch using the TLA, resulting in improved accuracy and reliability during the second monitoring run.
Learn more about Raman ready-to-use models in our webinar “Ready-to-Use Raman for Upstream Monitoring - Expanding Insights into Downstream & Novel Modalities”.
Enhancing Process Efficiency and Product Quality Through Real-time Monitoring
Continuous evaluation and adjustment of these models will be crucial for optimizing their monitoring capabilities in future bioprocess applications and extending their use to other important compounds in upstream processing, such as cell viability, amino acids, and glycoforms. Additionally, there is significant potential for applying a ready-to-use model strategy in downstream processing like tangential flow filtration (TFF) and novel modalities like mRNA and viral gene therapy (VGT) products.
By eliminating the complexities of model building, ProCellics™ Raman Analyzer’s ready-to-use models streamline implementation, improve process understanding, and pave the way for faster automation strategies. This application note serves as a foundation for further exploration and refinement of monitoring techniques in bioprocessing, emphasizing the importance of real-time data in enhancing process efficiency and product quality.
To request individualized support from our team, please fill out the dedicated form and upon submission, a technical expert will be in touch with you promptly.
This study was supported by ProBioGen AG (Berlin, Germany), a recognized leader in Contract Development and Manufacturing Organization (CDMO) services and pioneering technology provision. Learn more at www.probiogen.de
Related Product List
如要继续阅读,请登录或创建帐户。
暂无帐户?