跳转至内容
Merck
CN
HomeSmall Molecules Analysis & QCTLC Identification of Curcuminoids per USP Monograph

Thin-Layer Chromatographic Identification of Curcuminoids as per USP Monograph Using the TLC Explorer

Valanka D’Silva
R&D APAC Lab, Jigani, Bangalore, India

Abstract

This study utilizes the TLC Explorer to identify curcuminoids by TLC, following USP monograph guidelines. The system enhances TLC efficiency through automation and multiple illumination modes, accurately distinguishing curcumin, demethoxycurcumin, and bisdemethoxycurcumin. Results confirm the suitability of the TLC Explorer for curcuminoid analysis.

Section Overview

Introduction

Curcuminoids are bioactive compounds present in the roots of turmeric (Curcuma longa), a spice widely used in Asian cuisines. These compounds include curcumin, demethoxycurcumin, and bisdemethoxycurcumin (Figure 1).

Known for their potential health benefits, curcuminoids possess anti-inflammatory, antioxidant, and anticancer properties.1 They are often researched for their impact on various health issues, such as arthritis, cardiovascular diseases, and specific cancers. Typically, curcuminoids are consumed through turmeric supplements, extracts, or as part of the diet from turmeric spice.2

Black-and-white skeletal chemical structures of three curcuminoid compounds arranged from left to right. On the left is curcumin, which consists of two aromatic rings each substituted with a hydroxyl group and a methoxy group, connected by a seven-carbon chain containing two α,β-unsaturated carbonyl groups. In the middle is demethoxycurcumin, which has a similar backbone to curcumin but only one of the aromatic rings contains a methoxy group; the other ring has just a hydroxyl group. On the right is bisdemethoxycurcumin, which features two aromatic rings each with only one hydroxyl group, with no methoxy substitutions, and the same central diketone linkage connecting them.

Figure 1.Chemical structures of curcumin, demethoxycurcumin, and bisdemethoxycurcumin.

The United States Pharmacopeia (USP) monograph for curcuminoids identifies thin layer chromatography (TLC) as one method for testing identification.3 TLC is frequently referenced in pharmacopeial methods for identity testing. High-Performance Thin Layer Chromatography (HPTLC), a high-performance version of TLC and often used with automation, is a robust, reliable, rapid, and cost-effective technique used for the qualitative and quantitative analysis of pharmaceutical compounds. This method produces chromatographic fingerprints that can be visualized and stored as electronic images.4,5

This application note presents the identification test for curcuminoids, including curcumin, demethoxycurcumin, and bisdemethoxycurcumin, as specified in the USP monograph, performed using the new TLC Explorer documentation system (Figure 2).
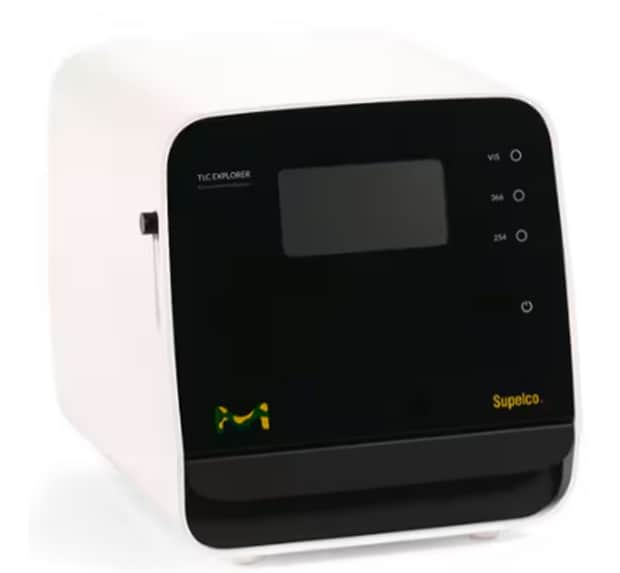
A compact laboratory instrument, TLC Explorer, with a white body and a glossy black front panel. The front features a rectangular screen in the upper center, likely used for displaying readings or navigation menus. To the right of the screen are three vertically aligned indicator labels marked “VIS,” “365,” and “254,” corresponding to different light wavelengths used for TLC plate visualization. Below the screen, the black surface includes a bright green and yellow Merck logo on the left and the brand name “Supelco” in yellow on the right. The left side of the device has a small protruding switch or button. The overall design is sleek and minimalistic, with the device sitting on a white surface, suggesting it is ready for benchtop use in an analytical laboratory setting.

Figure 2.TLC Explorer.

The TLC Explorer documentation system enables the digital and automated evaluation of TLC plates, enhancing the efficiency and accuracy of thin layer chromatography analysis. The device offers three illumination modes using LED light sources—white light (VIS), UV-A (366 nm), and UV-C (254 nm) – for the detection and fast measurement of the compounds of interest. The software offers special features like automated track recognition, simultaneous measurement of multiple plates and background signal correction. Overall, the TLC Explorer offers accurate TLC imaging for reliable densitometric measurements, enabling quantitative analysis and reliable data interpretation. 

Experimental

Reagent Preparation

  • Mobile phase: Mix toluene and glacial acetic acid in a ratio of 4:1, v:v.
  • Derivatization reagent: Add 10 mL of glacial acetic acid and 5 mL of sulfuric acid to 85 mL of ice-cold methanol slowly. Mix and allow the mixture to cool to room temperature. Then add 0.5 mL of p-anisaldehyde and mix well.

Standard Preparation

  • Curcuminoids standard solution (1 mg/mL): Weigh and dissolve 5 mg of USP Curcuminoids RS in 5 mL of methanol.
  • Curcumin standard solution (1 mg/mL): Weigh and dissolve 5 mg of curcumin in 1 mL of methanol.
  • Demethoxycurcumin standard solution (1 mg/mL): Weigh and dissolve 5 mg of demethoxycurcumin in 5 mL of methanol.
  • Bisdemethoxycurcumin standard solution (1 mg/mL): Weigh and dissolve 5 mg of bisdemethoxycurcumin in 5 mL of methanol.

Sample Preparation

Test solutions I + II: Weigh 5 mg of curcuminoids in 5 mL of methanol. Sonicate for 10 minutes and centrifuge at 3000 rpm for 5 minutes. The resulting supernatant solution contains 1 mg/mL of curcuminoids.

 Instrument Parameters

Results

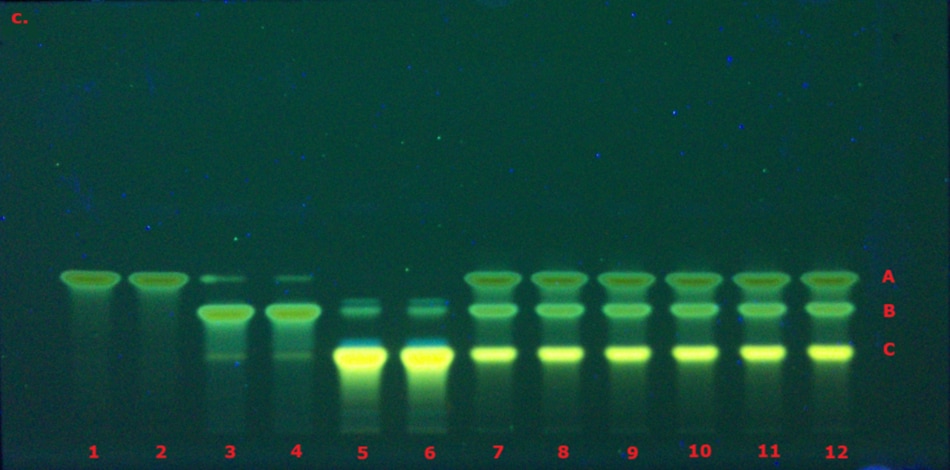
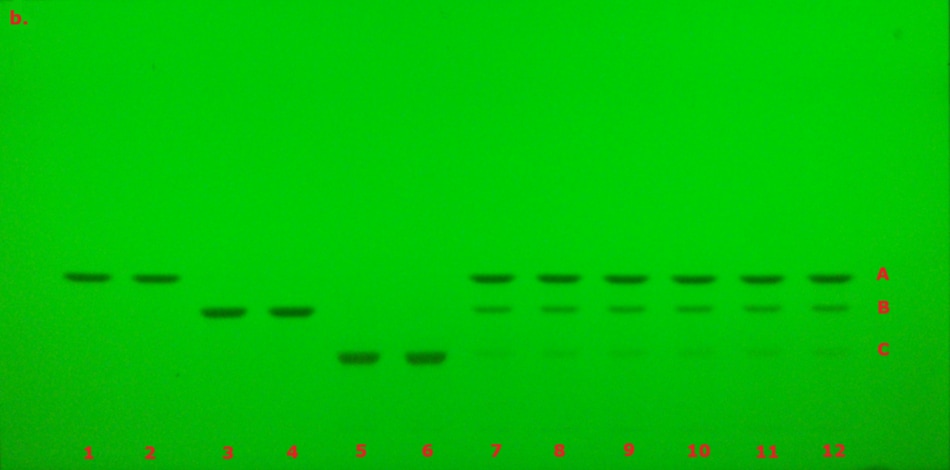
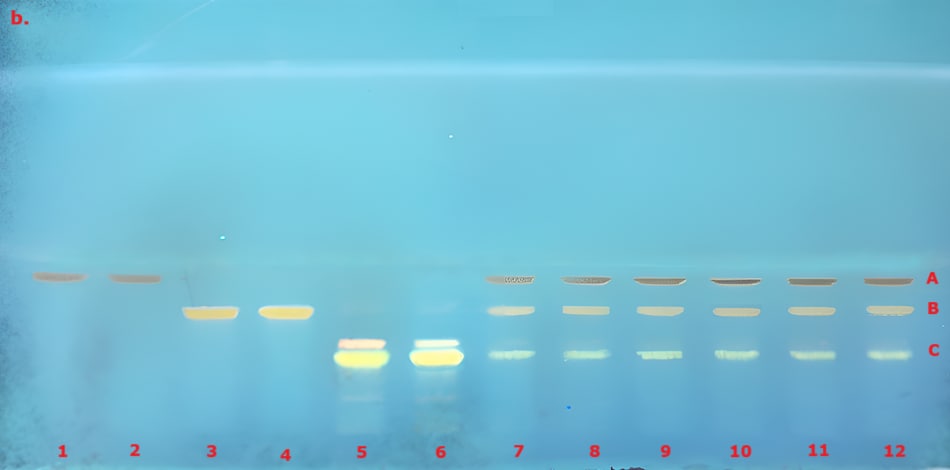
The identification of curcuminoid extract performed according to USP monograph prior to derivatization under visible/white light (VIS) and 366 nm (here in addition also under 254 nm for comparison) on the TLC Explorer is demonstrated in Figure 3, and after derivatization under VIS and 366 nm is demonstrated in Figure 4. The derivatized chromatogram of the standard solutions under UV 366 nm shows three bands in the order of increasing Rf: an orange band due to bisdesmethoxycurcumin, an orange band due to desmethoxycurcumin, and a red band due to curcumin, as described in the monograph. Under white light, the two lower bands appear orange, while the topmost band is reddish-pink. Table 2 summarizes the obtained chromatographic results.
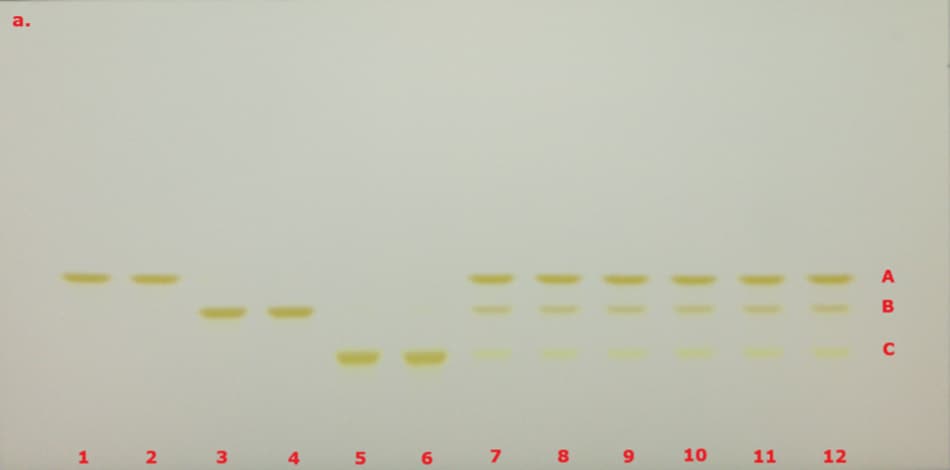
A thin-layer chromatography (TLC) plate with twelve sample lanes labeled 1 through 12 in red at the bottom. Each lane shows three horizontal bands of yellowish spots at varying heights, labeled A, B, and C on the right side in red. These fluorescent bands represent curcumin (top band A), demethoxycurcumin (middle band B), and bisdemethoxycurcumin (bottom band C). These bands represent separated components of the samples applied to the plate. The bands are clearly resolved and appear in consistent positions across lanes 7 to 12, indicating reproducible separation, while lanes 1 to 6 show varied band positions and intensities. The plate background is a light, neutral color, and the overall contrast highlights the separated spots effectively.
A thin-layer chromatography (TLC) plate visualized under ultraviolet light at 254 nm, with a bright green fluorescent background. There are twelve lanes labeled with red numbers at the bottom, and three horizontal bands labeled A, B, and C on the right side, also in red. These fluorescent bands represent curcumin (top band A), demethoxycurcumin (middle band B), and bisdemethoxycurcumin (bottom band C). The sample bands appear as dark green to black spots against the green background, indicating the absorption of UV light by the analytes. The bands are well-aligned across lanes, representing the separation of three different compounds.
A TLC plate visualized under ultraviolet light at 366 nm, with a dark blue-green background. The twelve lanes are labeled in red at the bottom, with the same A, B, and C identifiers on the right. Three distinct bands appear in each lane, glowing in bright yellow with greenish halos. These fluorescent bands represent curcumin (top band A), demethoxycurcumin (middle band B), and bisdemethoxycurcumin (bottom band C). The strong yellow fluorescence of the bands against the dark background provides a clear contrast that highlights the successful separation and identification of the curcuminoids.

Figure 3. TLC chromatogram demonstrating the identification of curcuminoid extract prior to derivatization under VIS (a), UV 254 nm (b) and UV 366 nm (c) by the TLC Explorer. Band IDs: curcumin (A), demethoxycurcumin (B), and bisdemethoxycurcumin (C). Track allocation see Table 2.
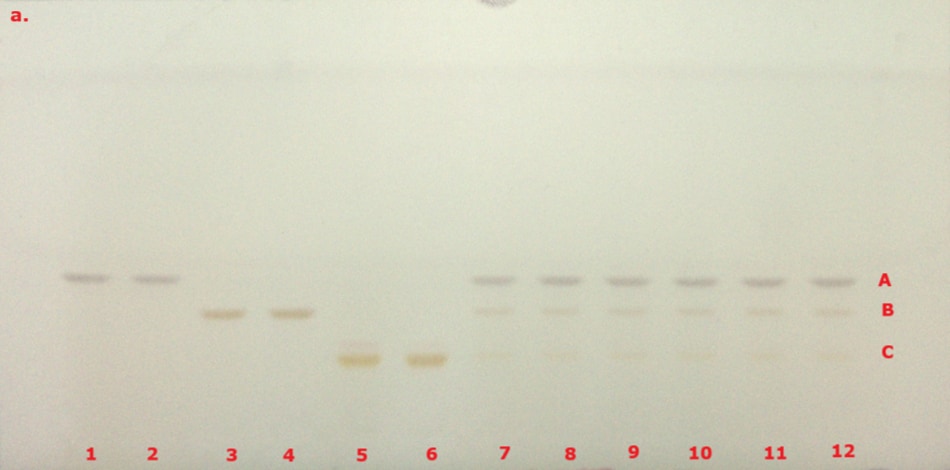
A thin-layer chromatography (TLC) plate photographed under visible light following derivatization of curcuminoid compounds. The plate has twelve lanes labeled numerically from 1 to 12 in red at the bottom, and three horizontal bands labeled A, B, and C along the right margin, also in red. Faint spots in light brown and beige tones are visible across the lanes, indicating the presence of three curcuminoid compounds. Band A, appearing in the highest position on the plate, represents curcumin; Band B in the middle represents demethoxycurcumin; and Band C at the bottom corresponds to bisdemethoxycurcumin. The spots are more pronounced in lanes 1 and 2 and gradually become fainter in lower concentrations across the remaining lanes.
A thin-layer chromatography (TLC) chromatogram under UV light at 366 nm, showcasing a gradient of colors against a pale blue background. The chromatogram features twelve numbered bands, with the first few bands appearing as faint yellowish-orange spots, gradually intensifying in color as you move towards the right. Specifically, band A, representing curcumin, stands out with a bright yellow hue, while band B, demethoxycurcumin, is slightly less vibrant, displaying a lighter shade of yellow. Band C, corresponding to bisdemethoxycurcumin, exhibits a more subdued yellow color. The bands are arranged horizontally, with clear spacing between them, highlighting the distinct separation of the curcuminoid extracts after derivatization.

Figure 4. TLC chromatogram demonstrating the identification of curcuminoid extract after derivatization under VIS (a) and UV 366 nm (b) by the TLC Explorer. Band IDs: curcumin (A), demethoxycurcumin (B), and bisdemethoxycurcumin (C). Track allocation see Table 2.

Conclusion

The derivatized chromatogram of the test solutions reveals two orange bands and one red band, which closely match the position and color of those found in the curcuminoid standard solution under VIS and UV 366 nm as described in the USP monograph. Under white light, the two lower orange bands and the upper darker red band correspond to bisdemethoxycurcumin, demethoxycurcumin, and curcumin in the curcuminoid standard solution, arranged in order of increasing retention factor.

This application note demonstrates that the TLC Explorer documentation system serves as an efficient TLC visualizer, enabling data capture, track identification, and Rf value calculation.

Find more information on the TLC Explorer Documentation System.


Related Products

Loading

References

1.
Basha SJ, Kaur K, Kaur P, Rehal J. 2024. Curcuminoids: Composition, extraction, health benefits, delivery systems, and relation to COVID‐19 treatment. Food Safety and Health. 2(1):21-38. https://doi.org/10.1002/fsh3.12028
2.
Munekata PE, Pateiro M, Zhang W, Dominguez R, Xing L, Fierro EM, Lorenzo JM. 2021. Health benefits, extraction and development of functional foods with curcuminoids. Journal of Functional Foods. 79104392. https://doi.org/10.1016/j.jff.2021.104392
3.
USP monograph: Curcuminoids. https://doi.org/10.31003/uspnf_m2499_04_01
4.
Attimarad M, Mueen Ahmed K, Aldhubaib BE, Harsha S. 2011. High-performance thin layer chromatography: A powerful analytical technique in pharmaceutical drug discovery. Pharmaceutical Methods. 2(2):71-75. https://doi.org/10.4103/2229-4708.84436
5.
Srivastava M. 2011. An Overview of HPTLC: A Modern Analytical Technique with Excellent Potential for Automation, Optimization, Hyphenation, and Multidimensional Applications. Springer.3-24. https://doi.org/10.1007/978-3-642-14025-9_1
登录以继续。

如要继续阅读,请登录或创建帐户。

暂无帐户?